Search
Leave a Message
Thank you for your message. We will be in touch with you shortly.
Explore Our Properties
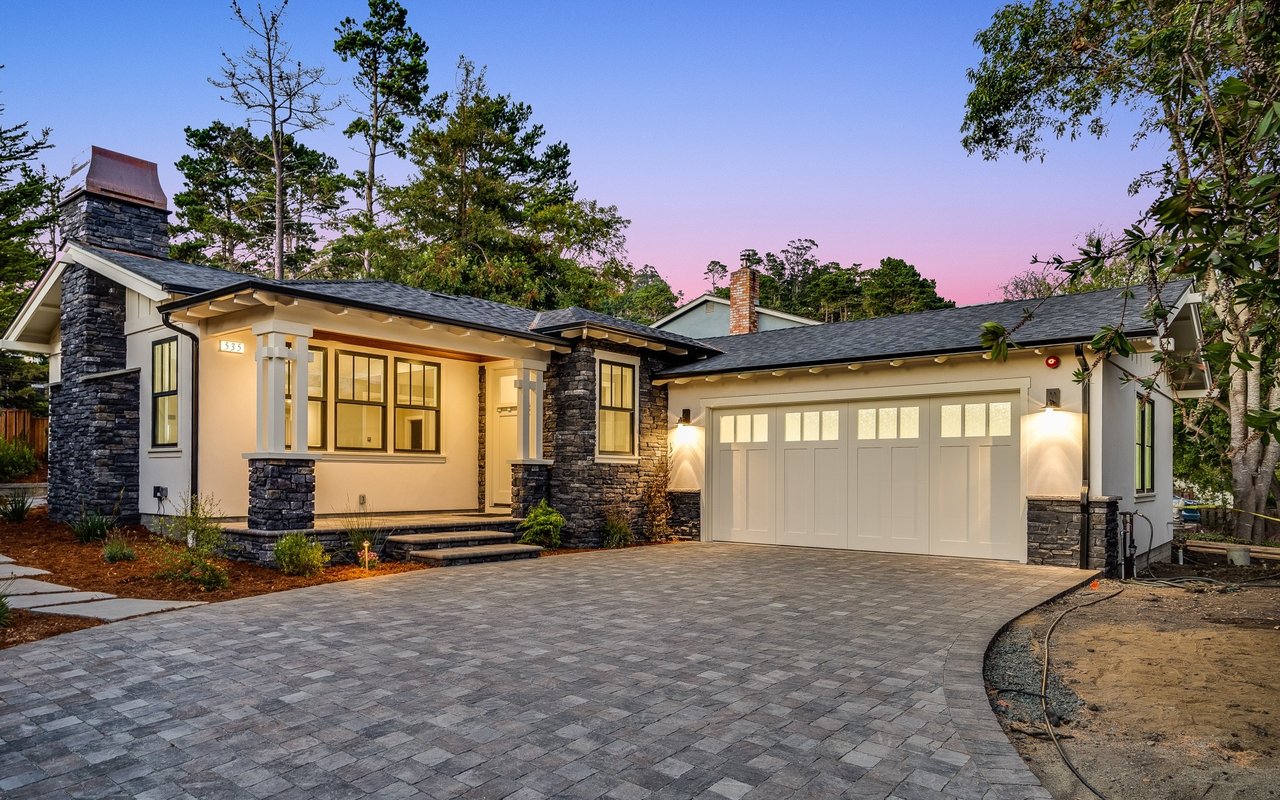
Single-story home with dark stone accents and a broad paved driveway at dusk.

2023 Mid-Peninsula Sales Recap

Explore the 2023 Mid-Peninsula sales recap, showcasing detailed market insights and trends across various regions.
Bryan Jacobs - CADRE# 01129660  |  January 23, 2024
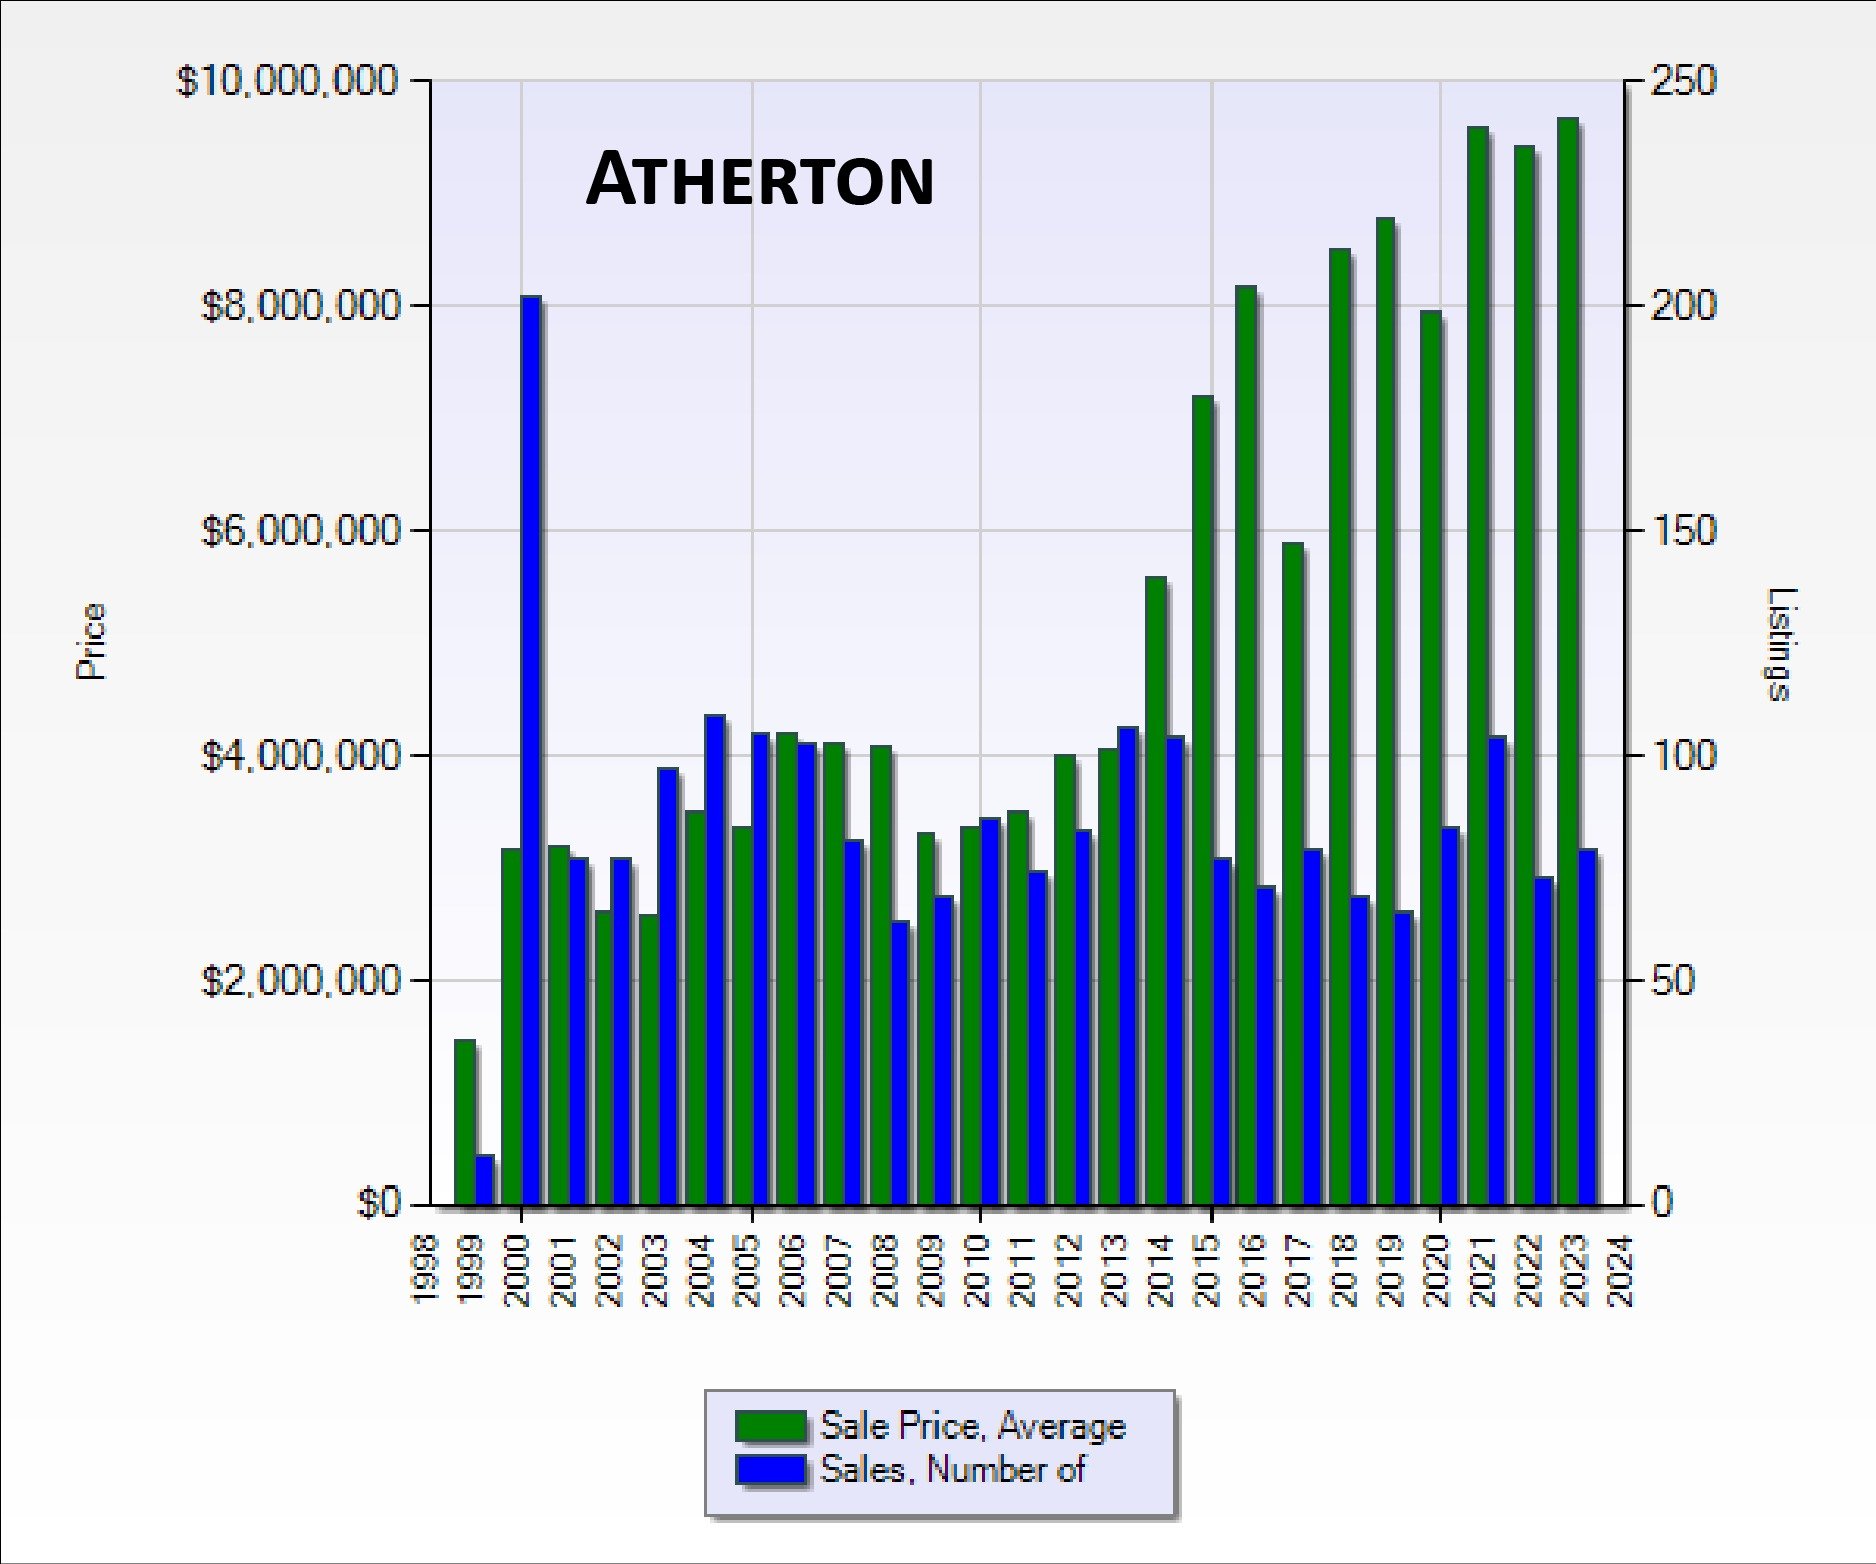
Atherton chart comparing average sale prices and number of sales by year, 1998–2023.
 
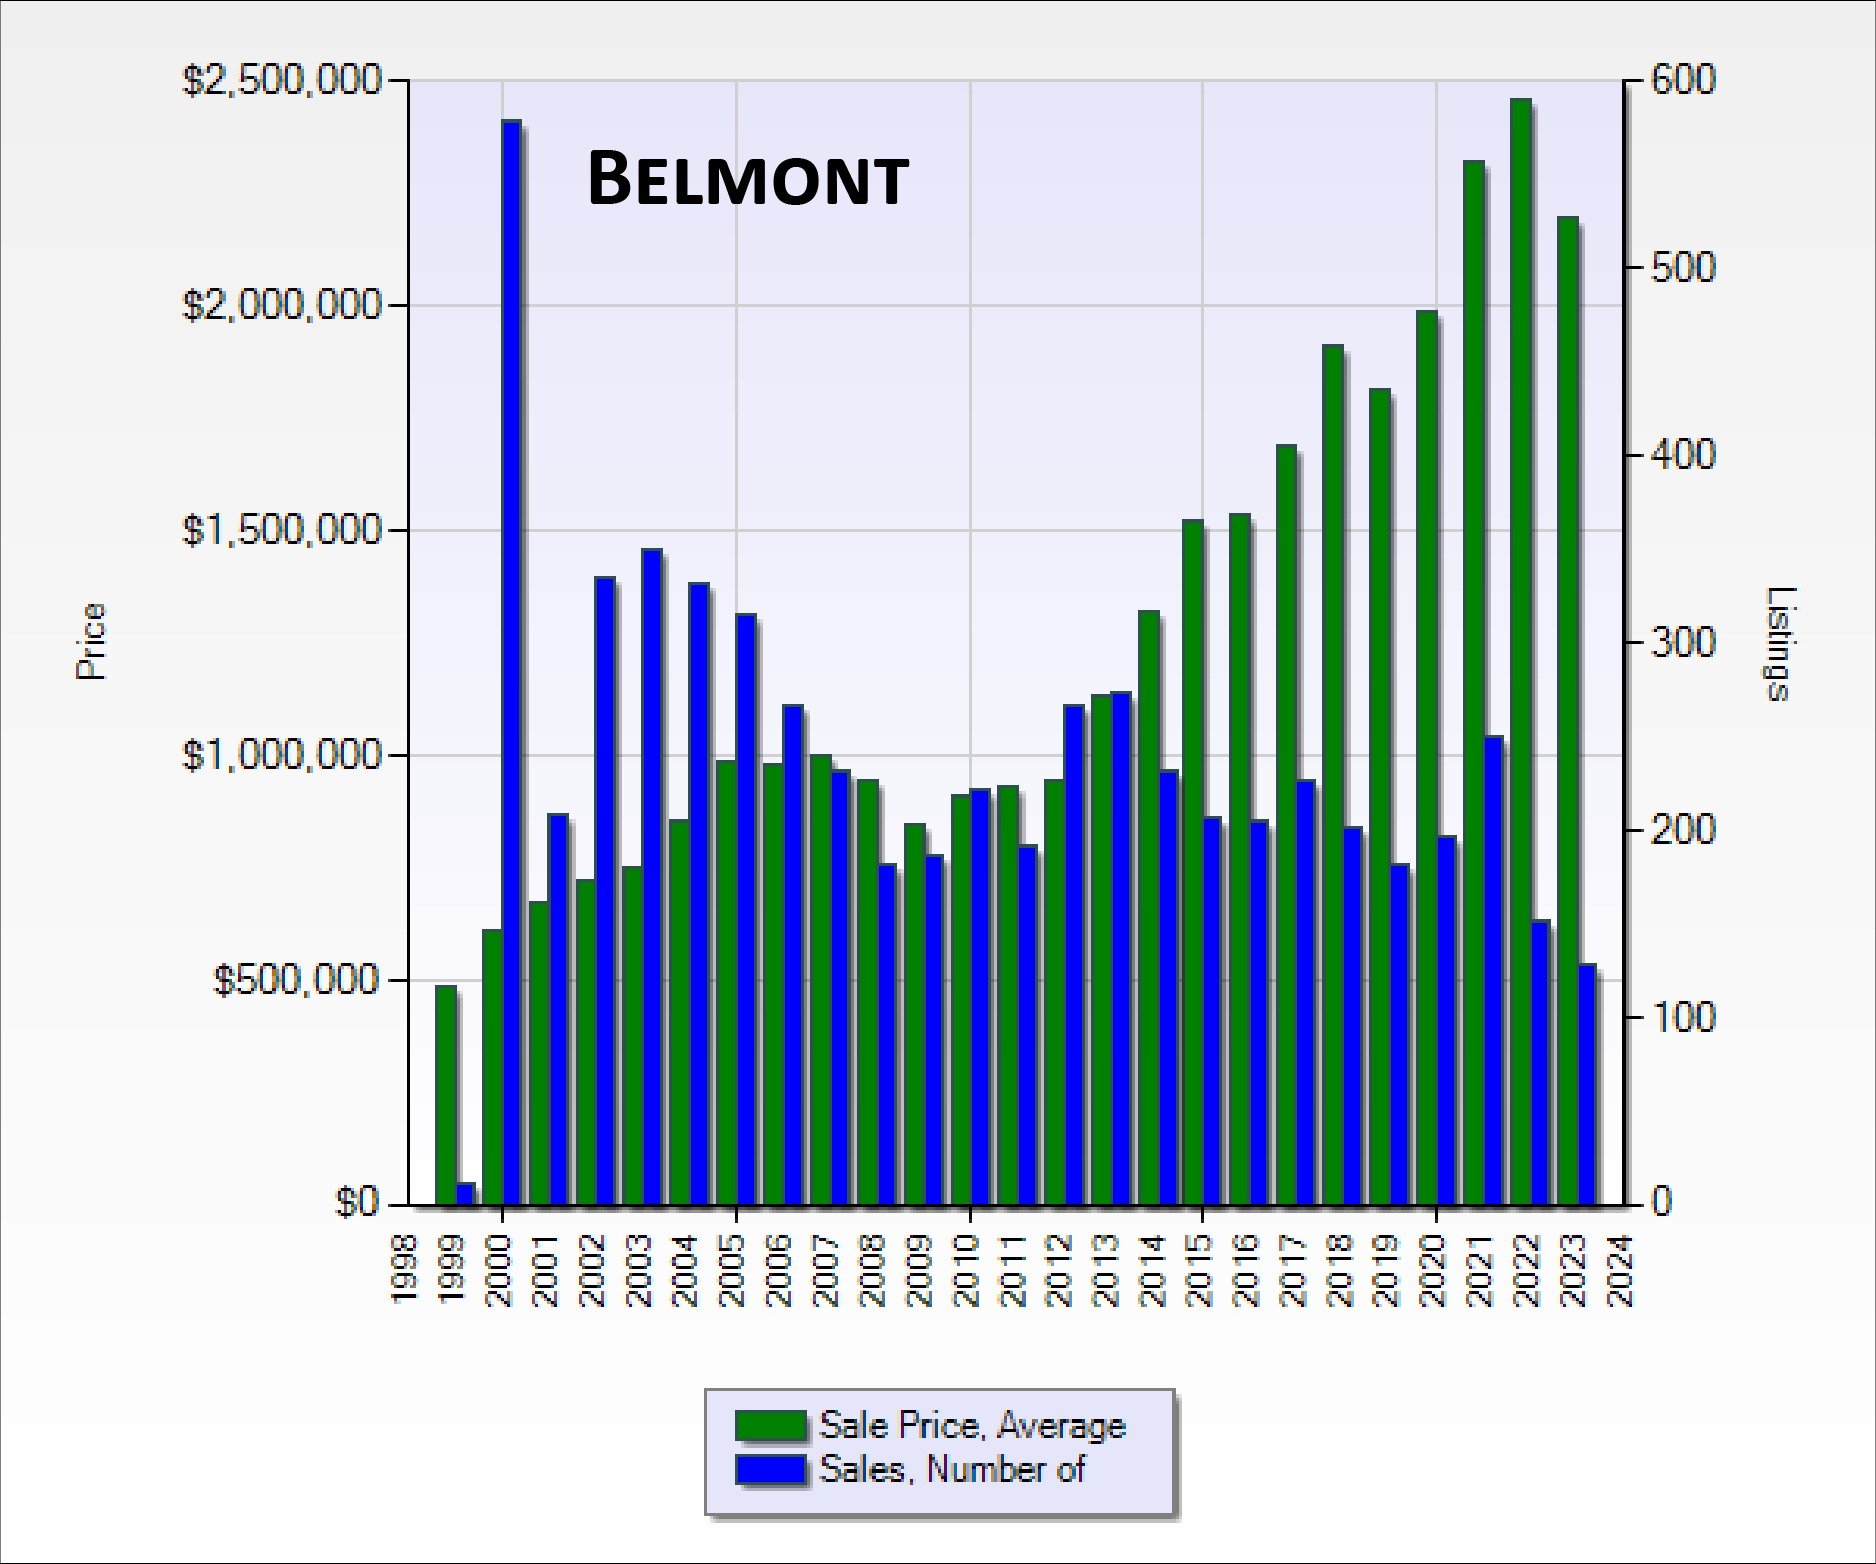
Belmont chart comparing average sale prices and sales counts from 1998 to 2024.
 
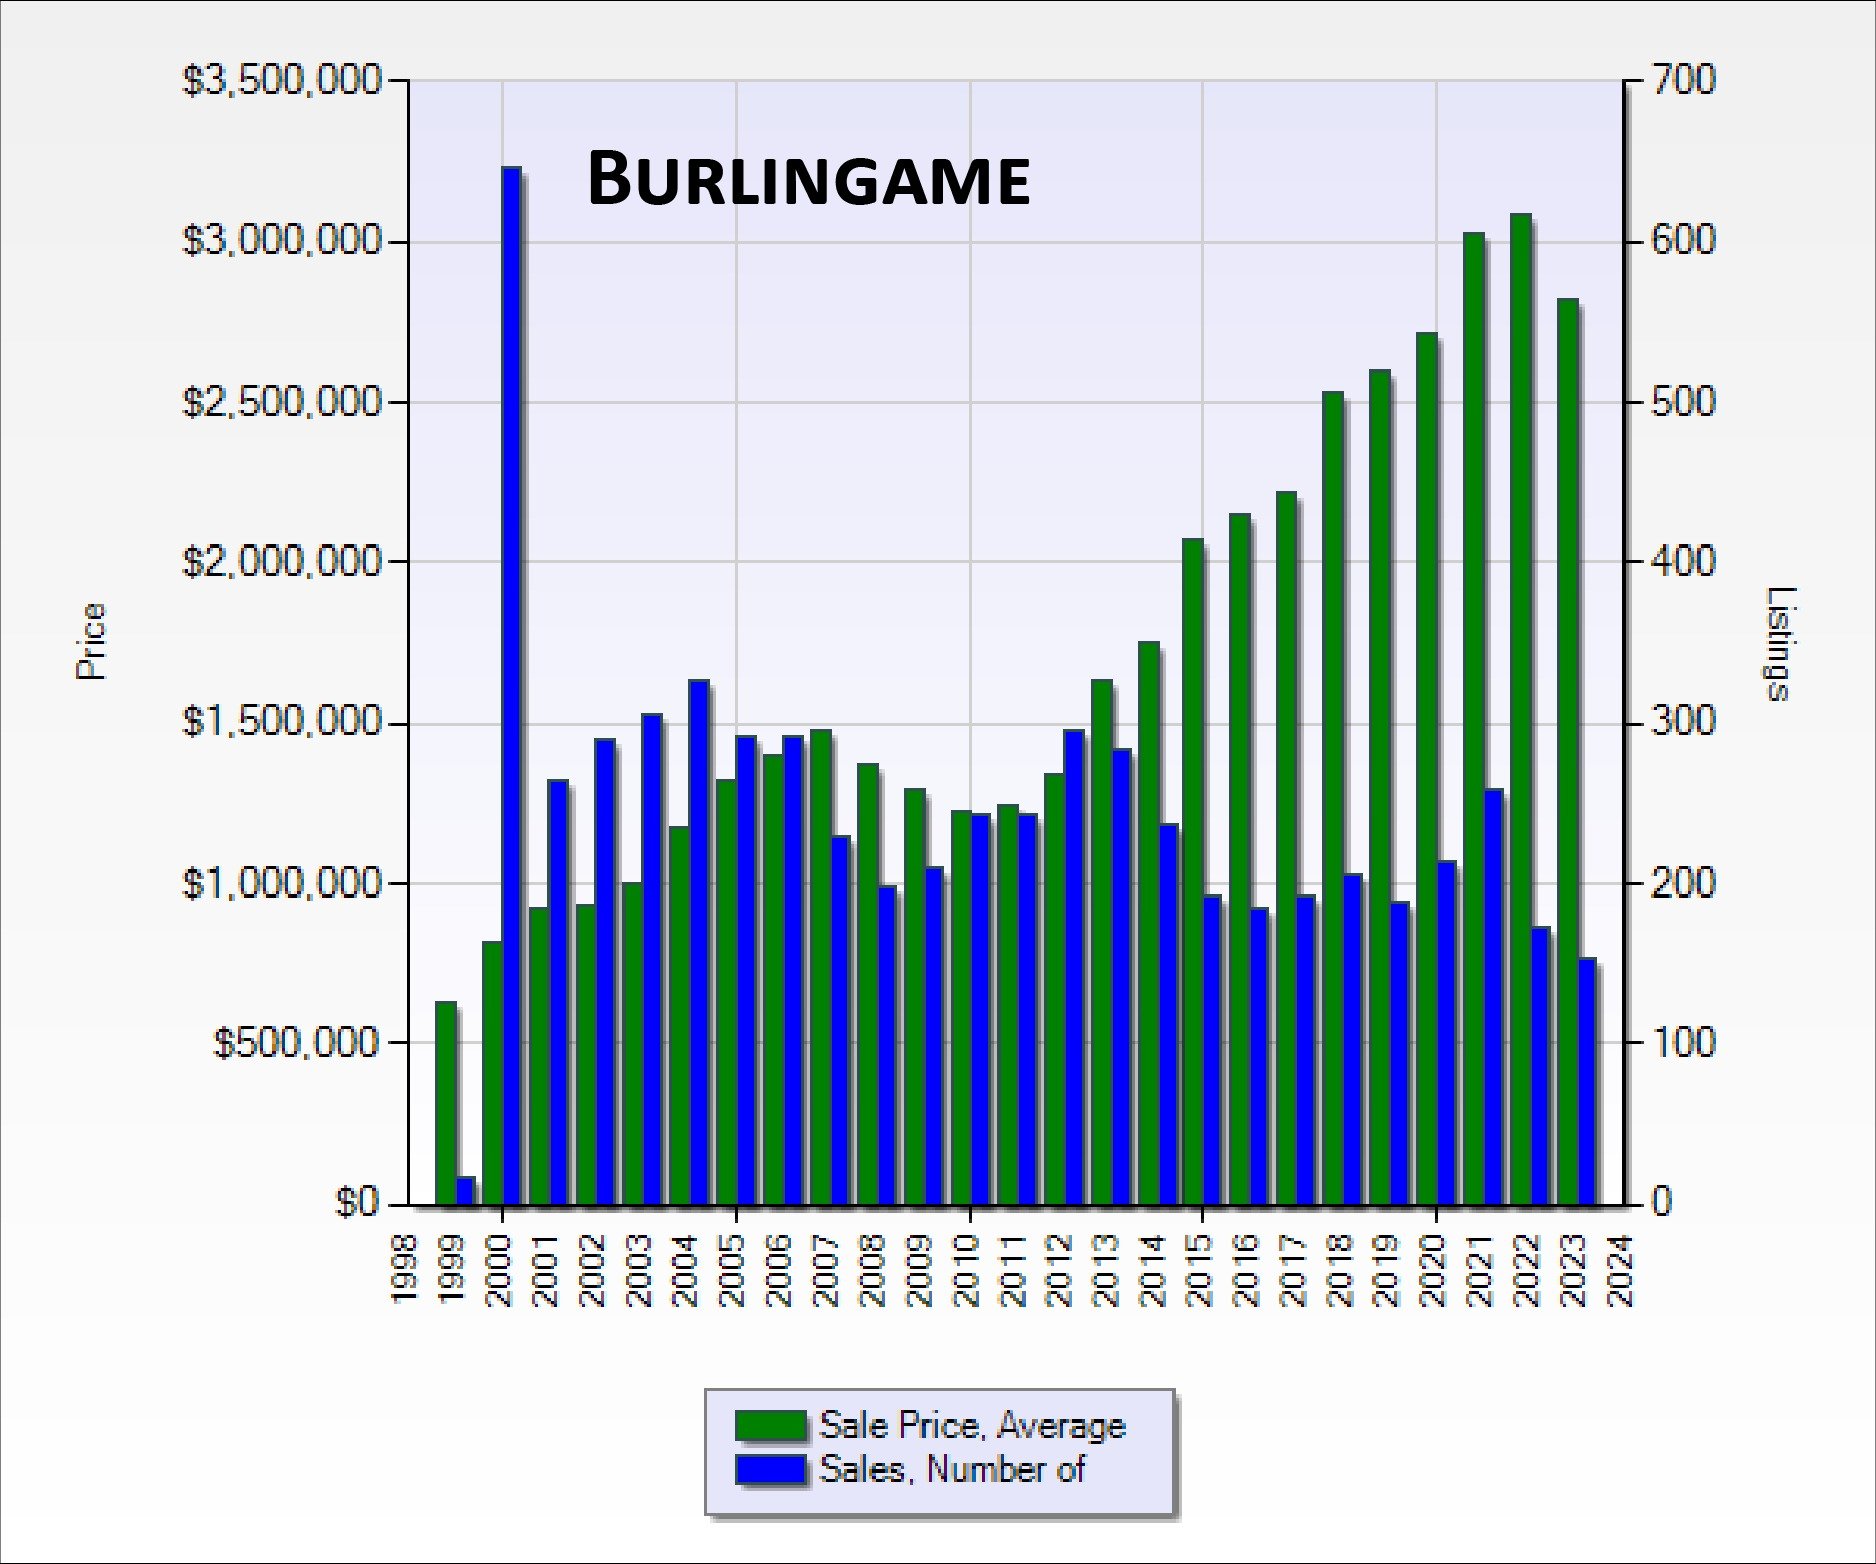
Burlingame chart of average sale prices and number of sales from 1998 to 2023.
 
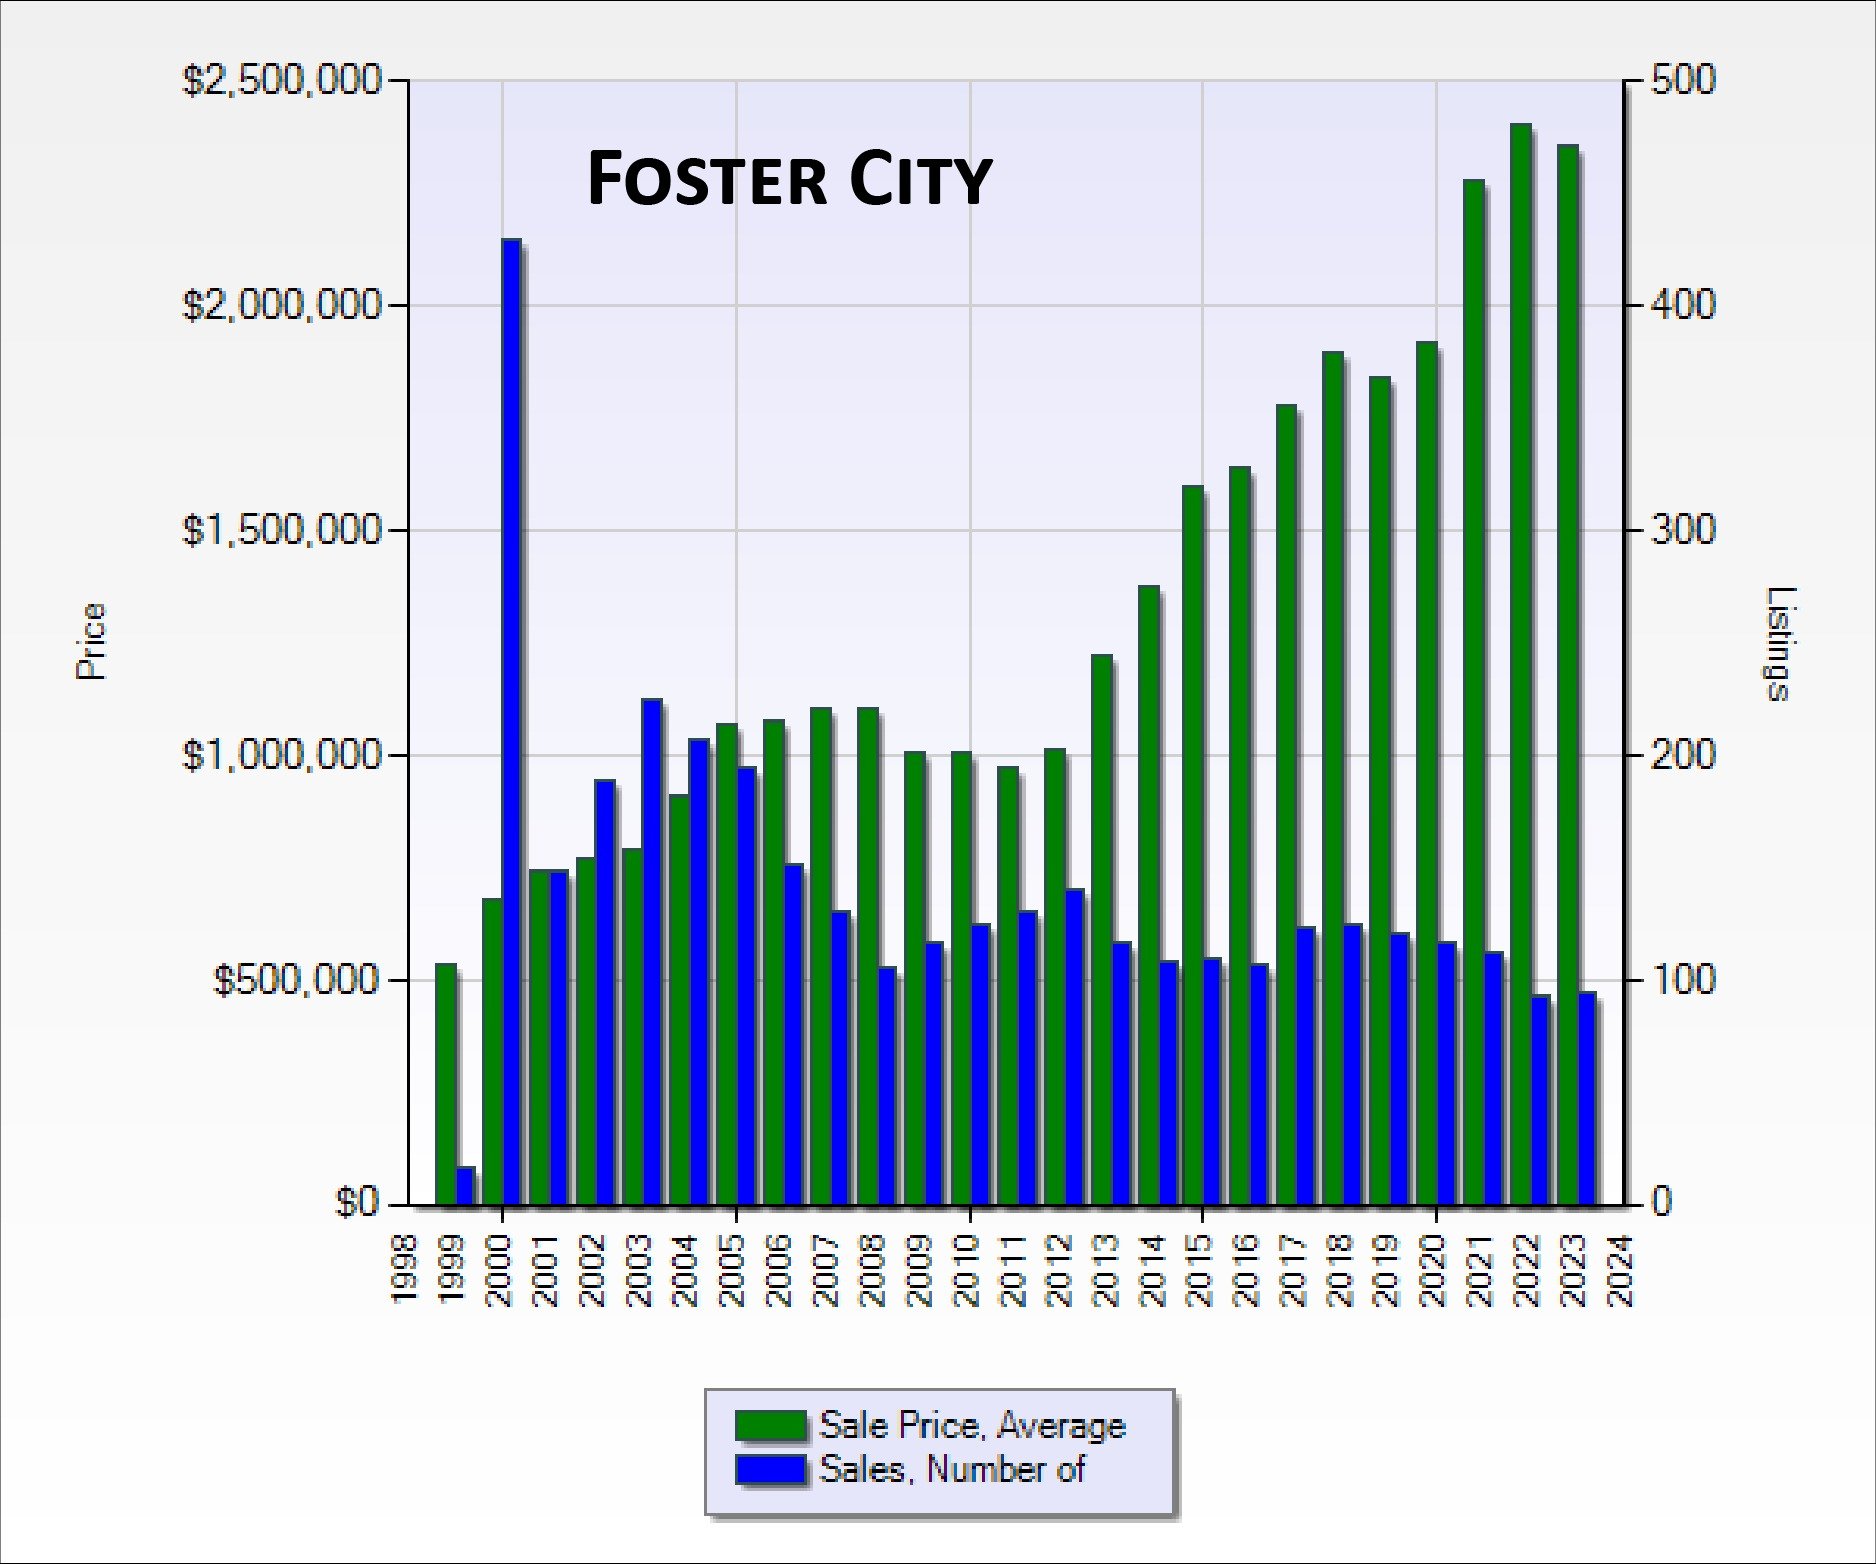
Foster City chart comparing average sale prices and number of sales from 1998 to 2023.
 
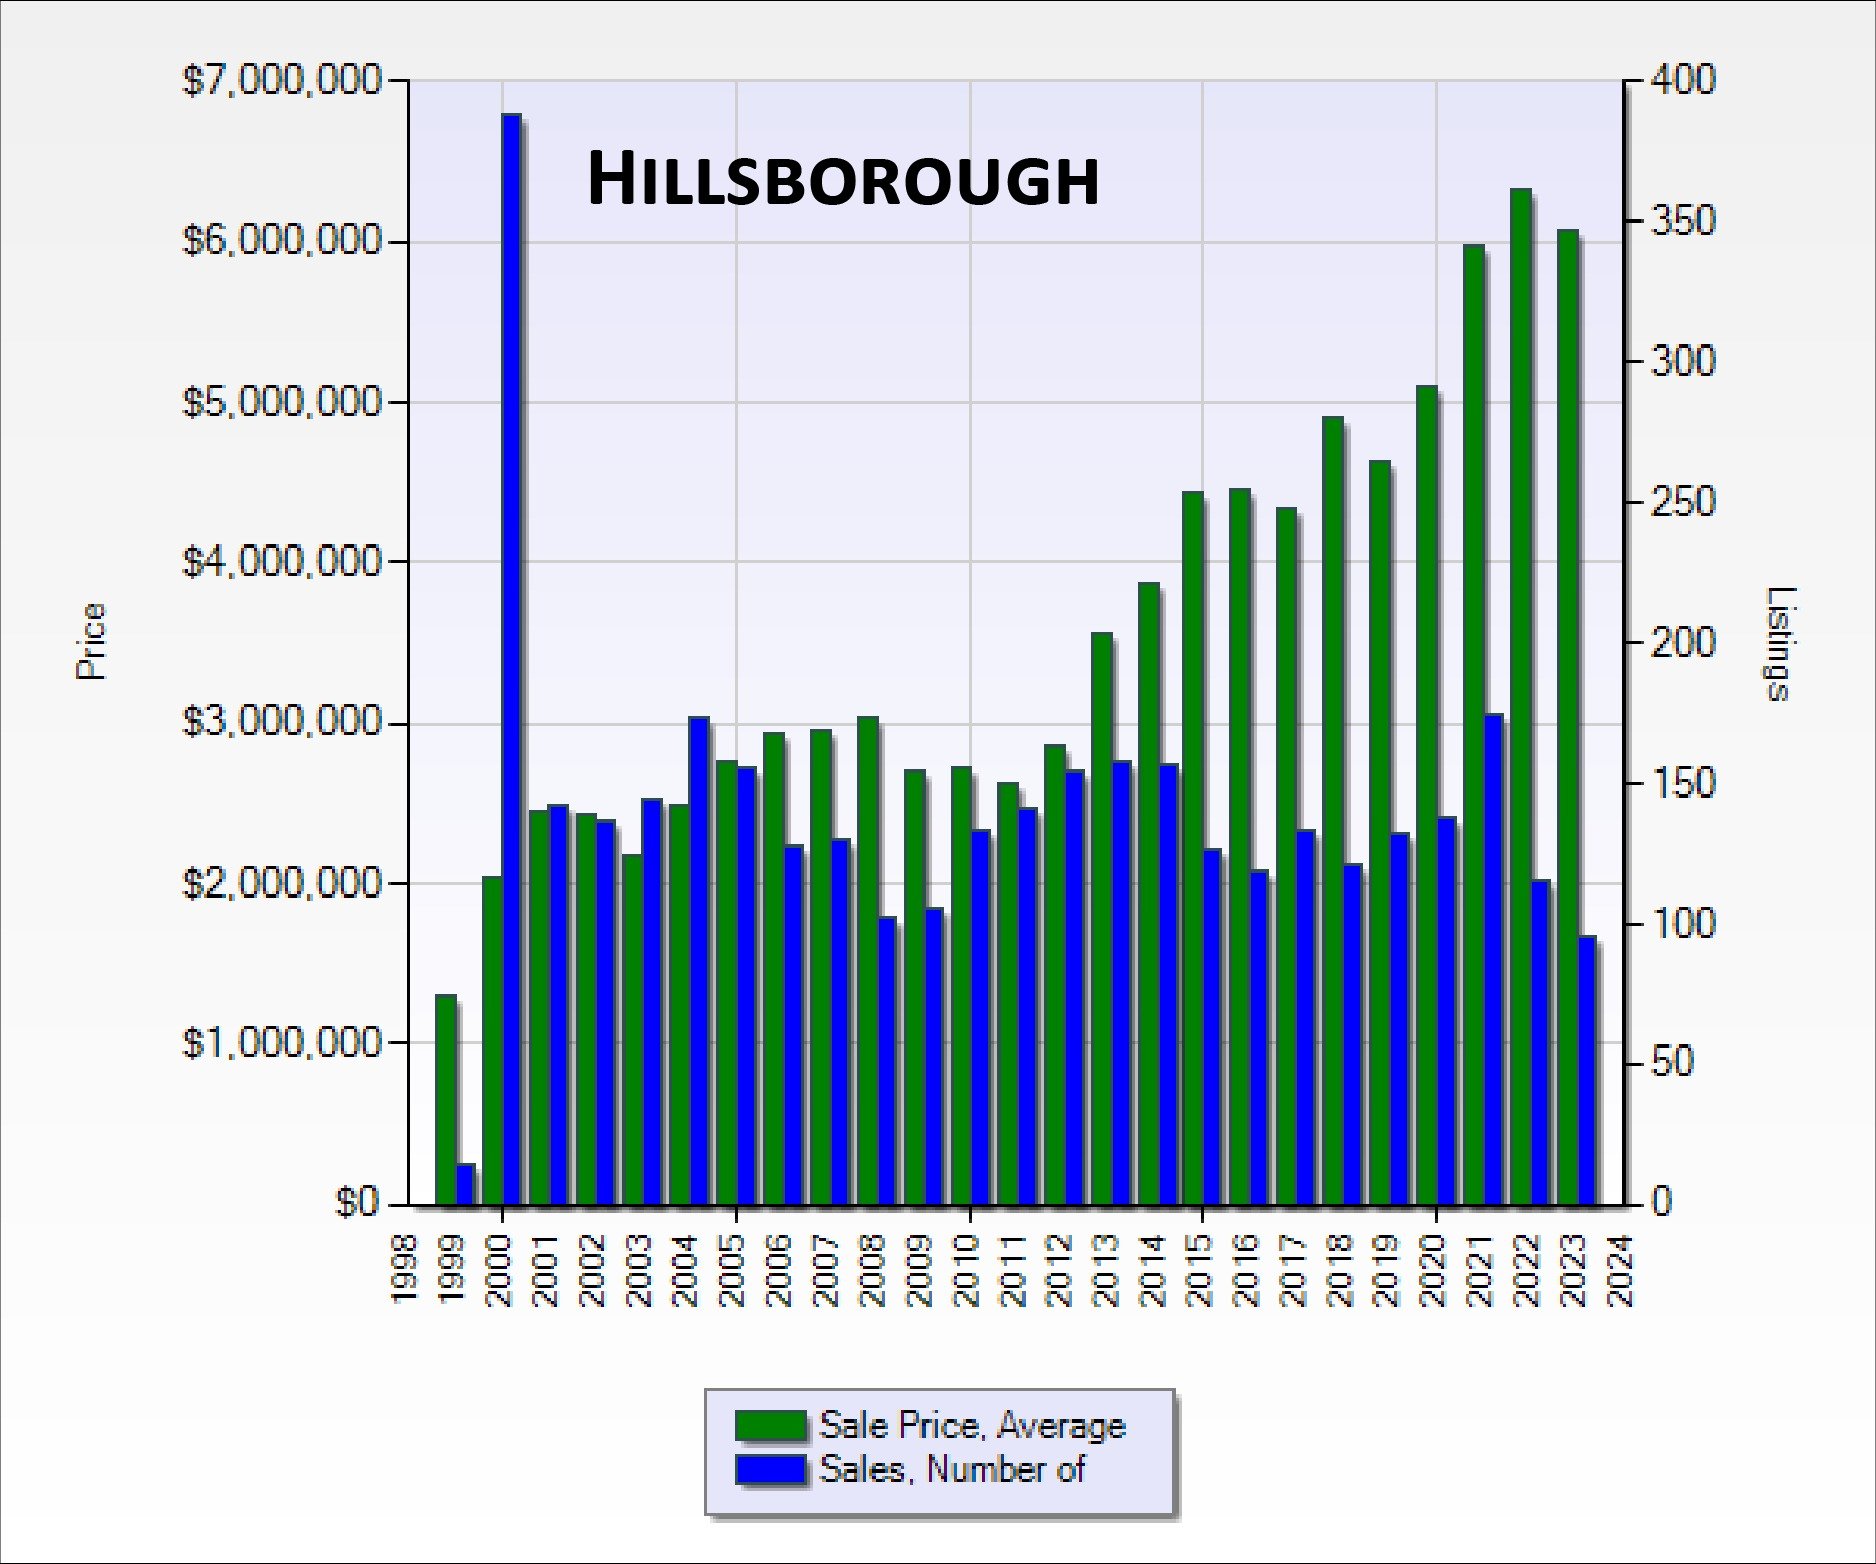
Hillsborough chart of average sale prices and sales counts from 1998 to 2024.
 
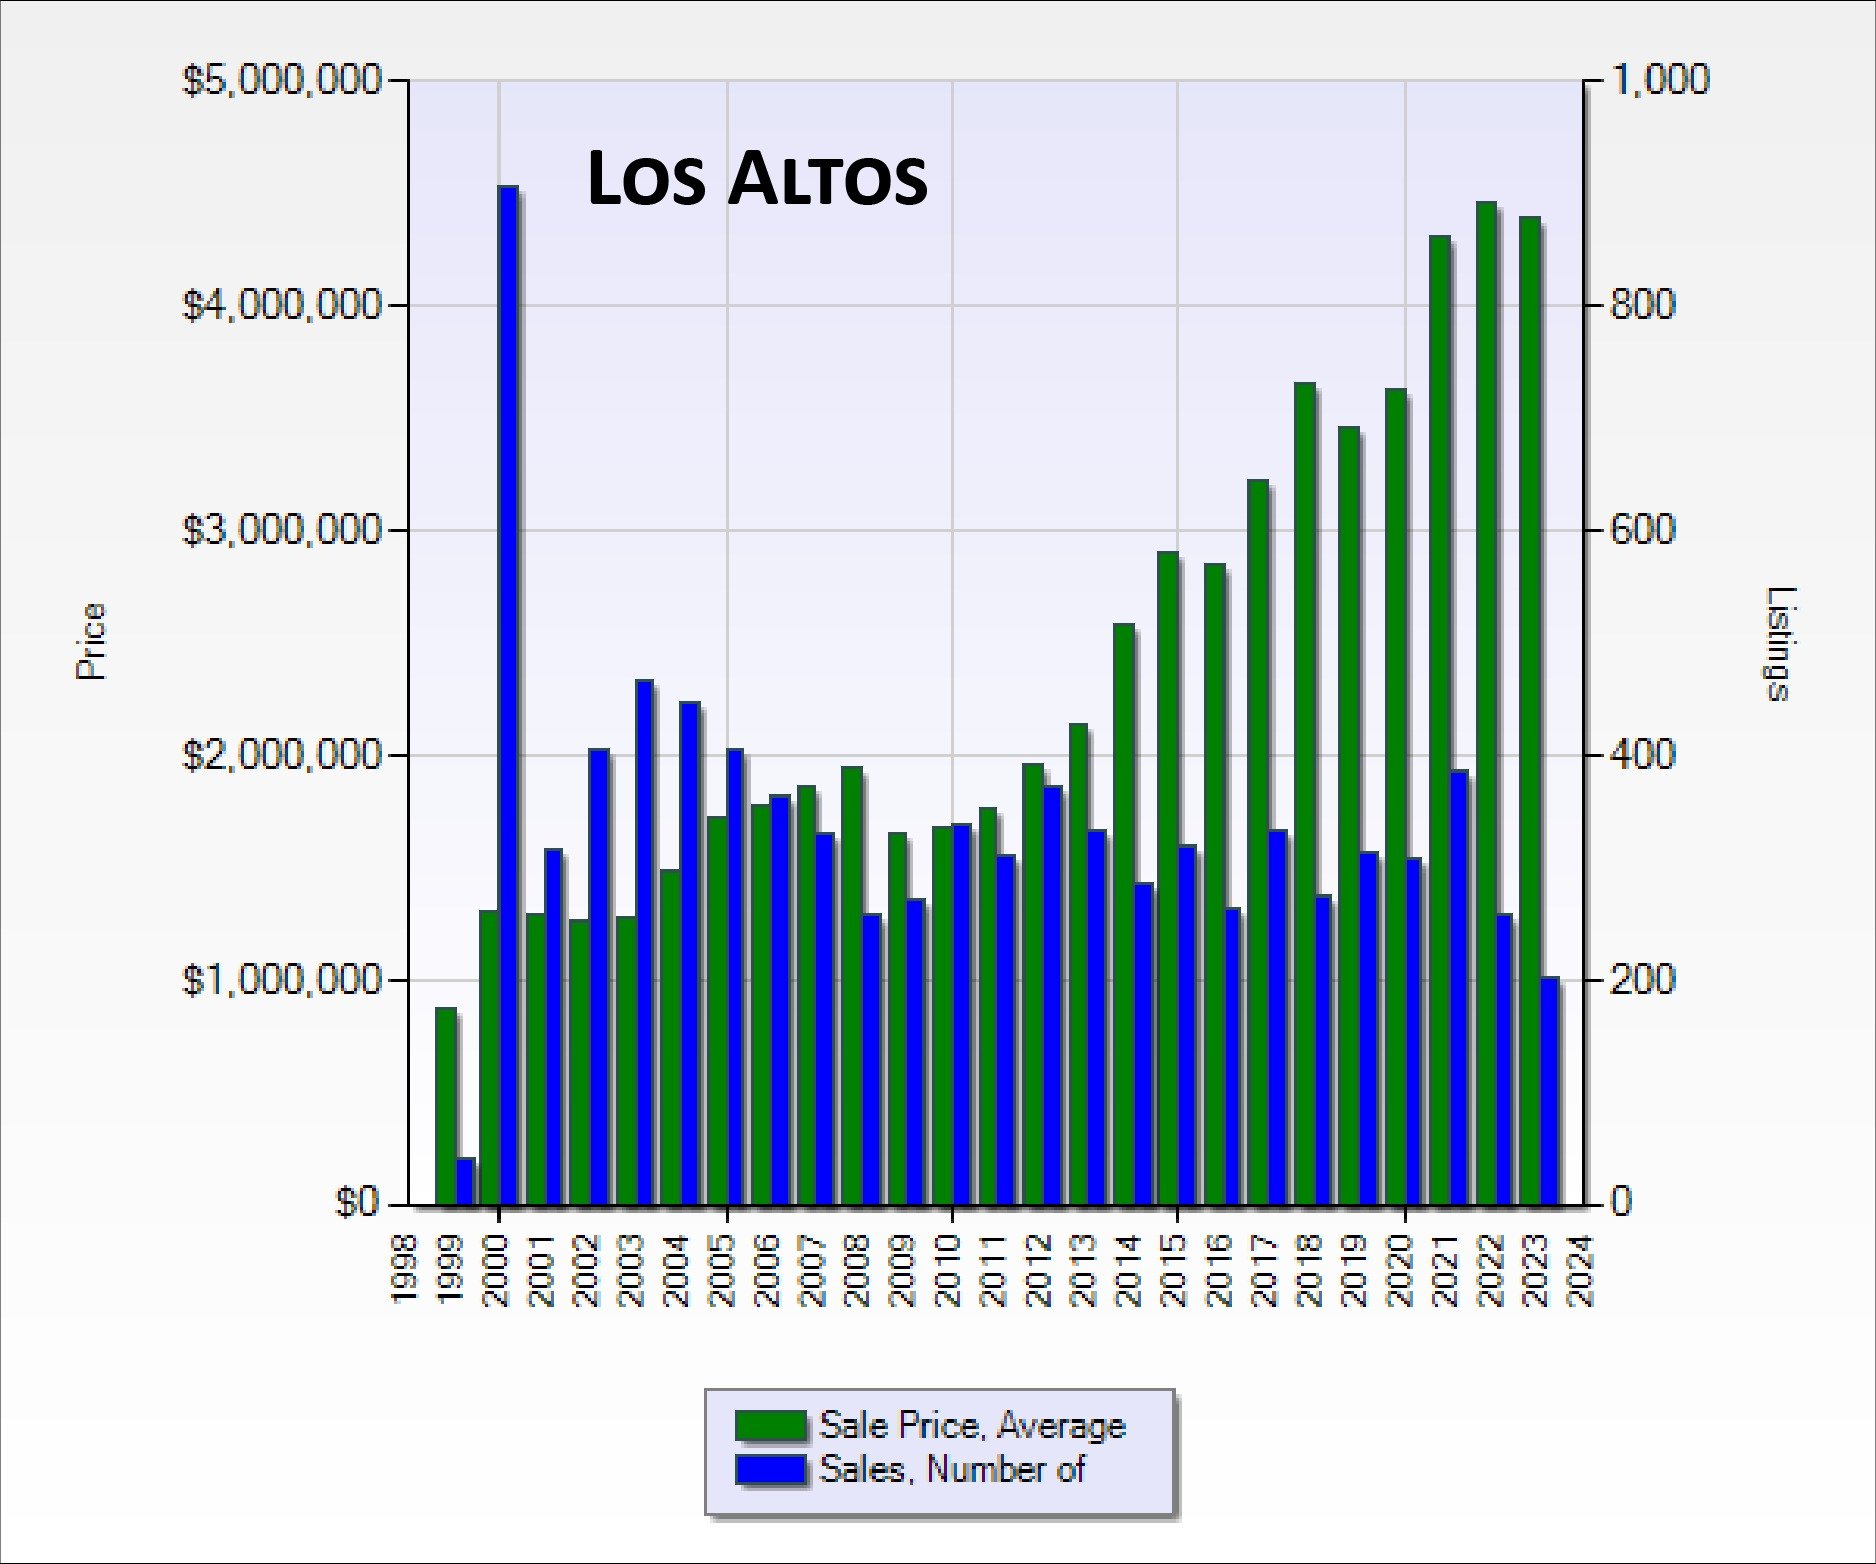
Los Altos chart of average sale prices and number of sales, 1998–2024.
 
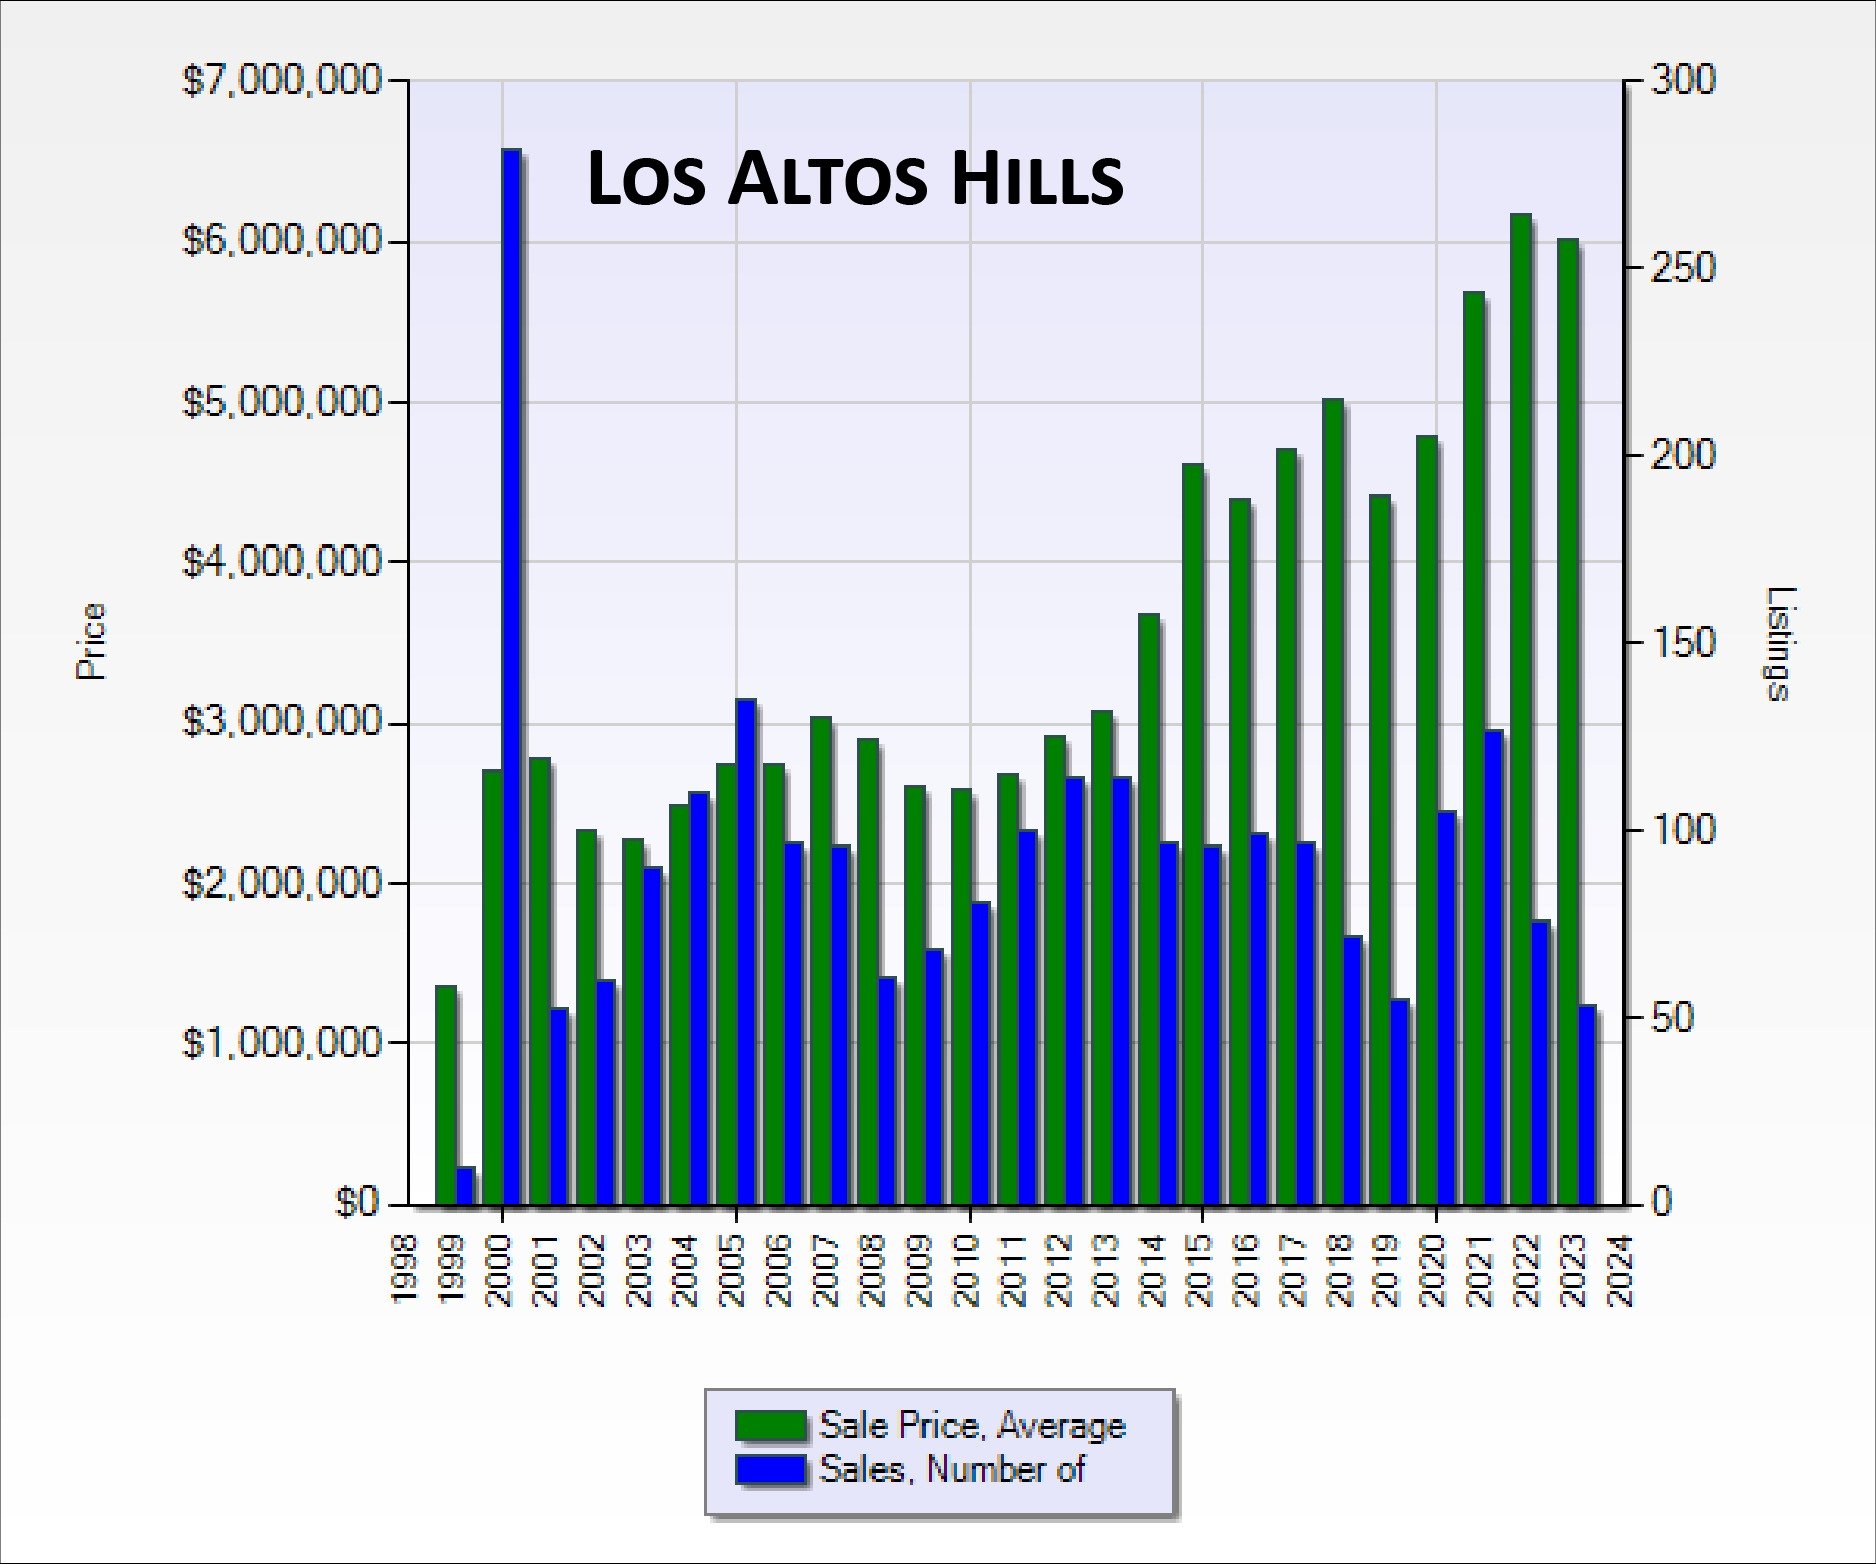
Los Altos Hills chart comparing average sale prices and sales counts from 1998 to 2024.
 
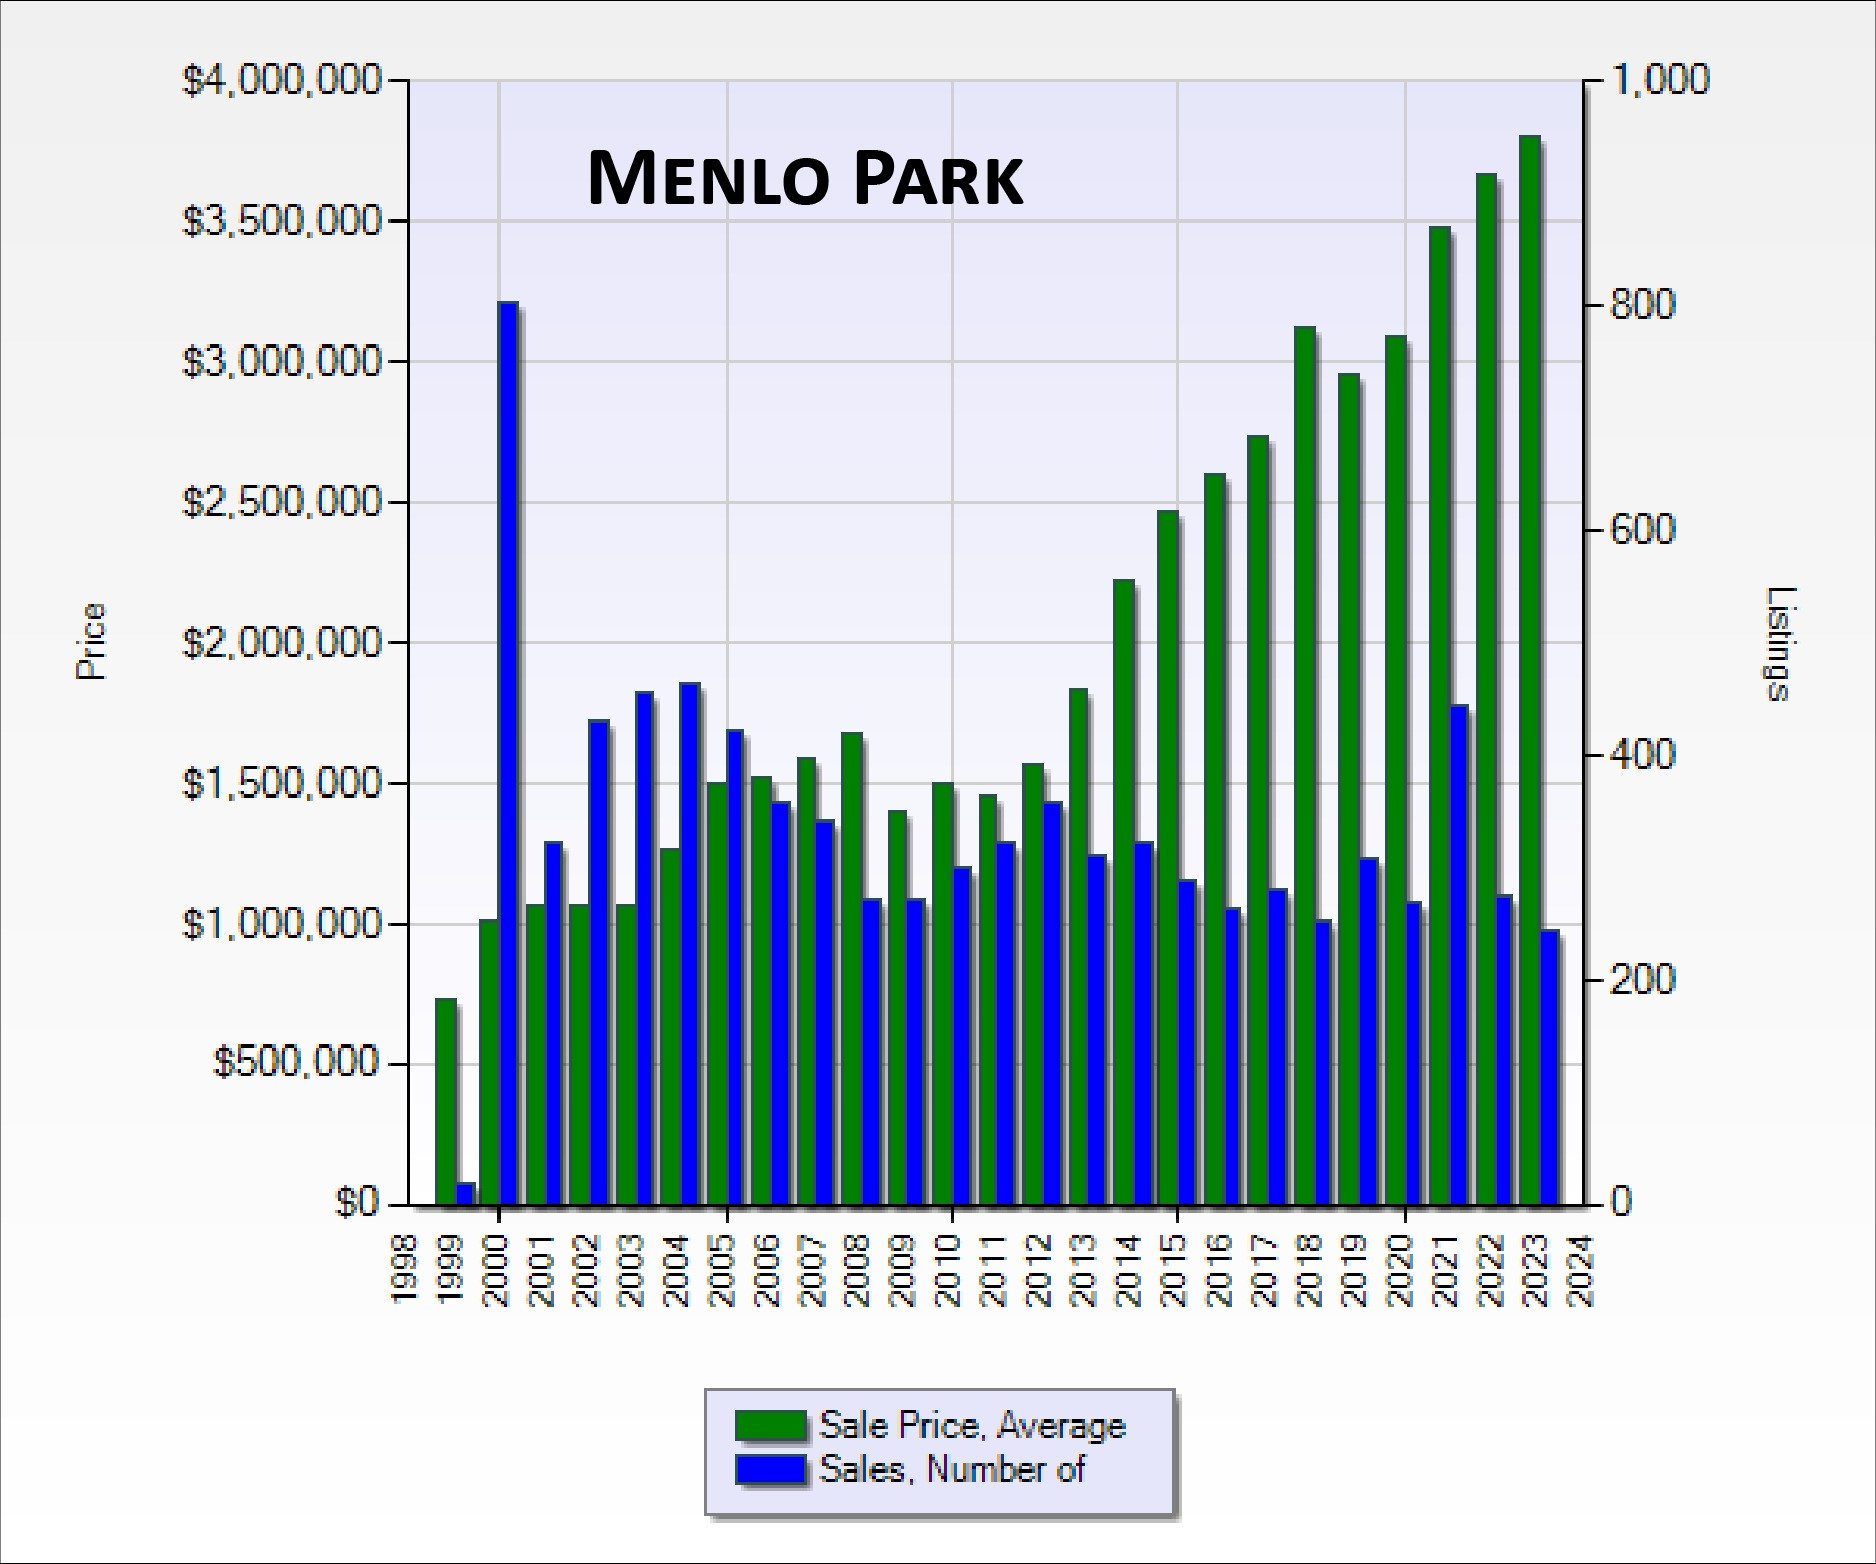
Menlo Park chart comparing average sale prices and number of sales from 1998 to 2024.
 
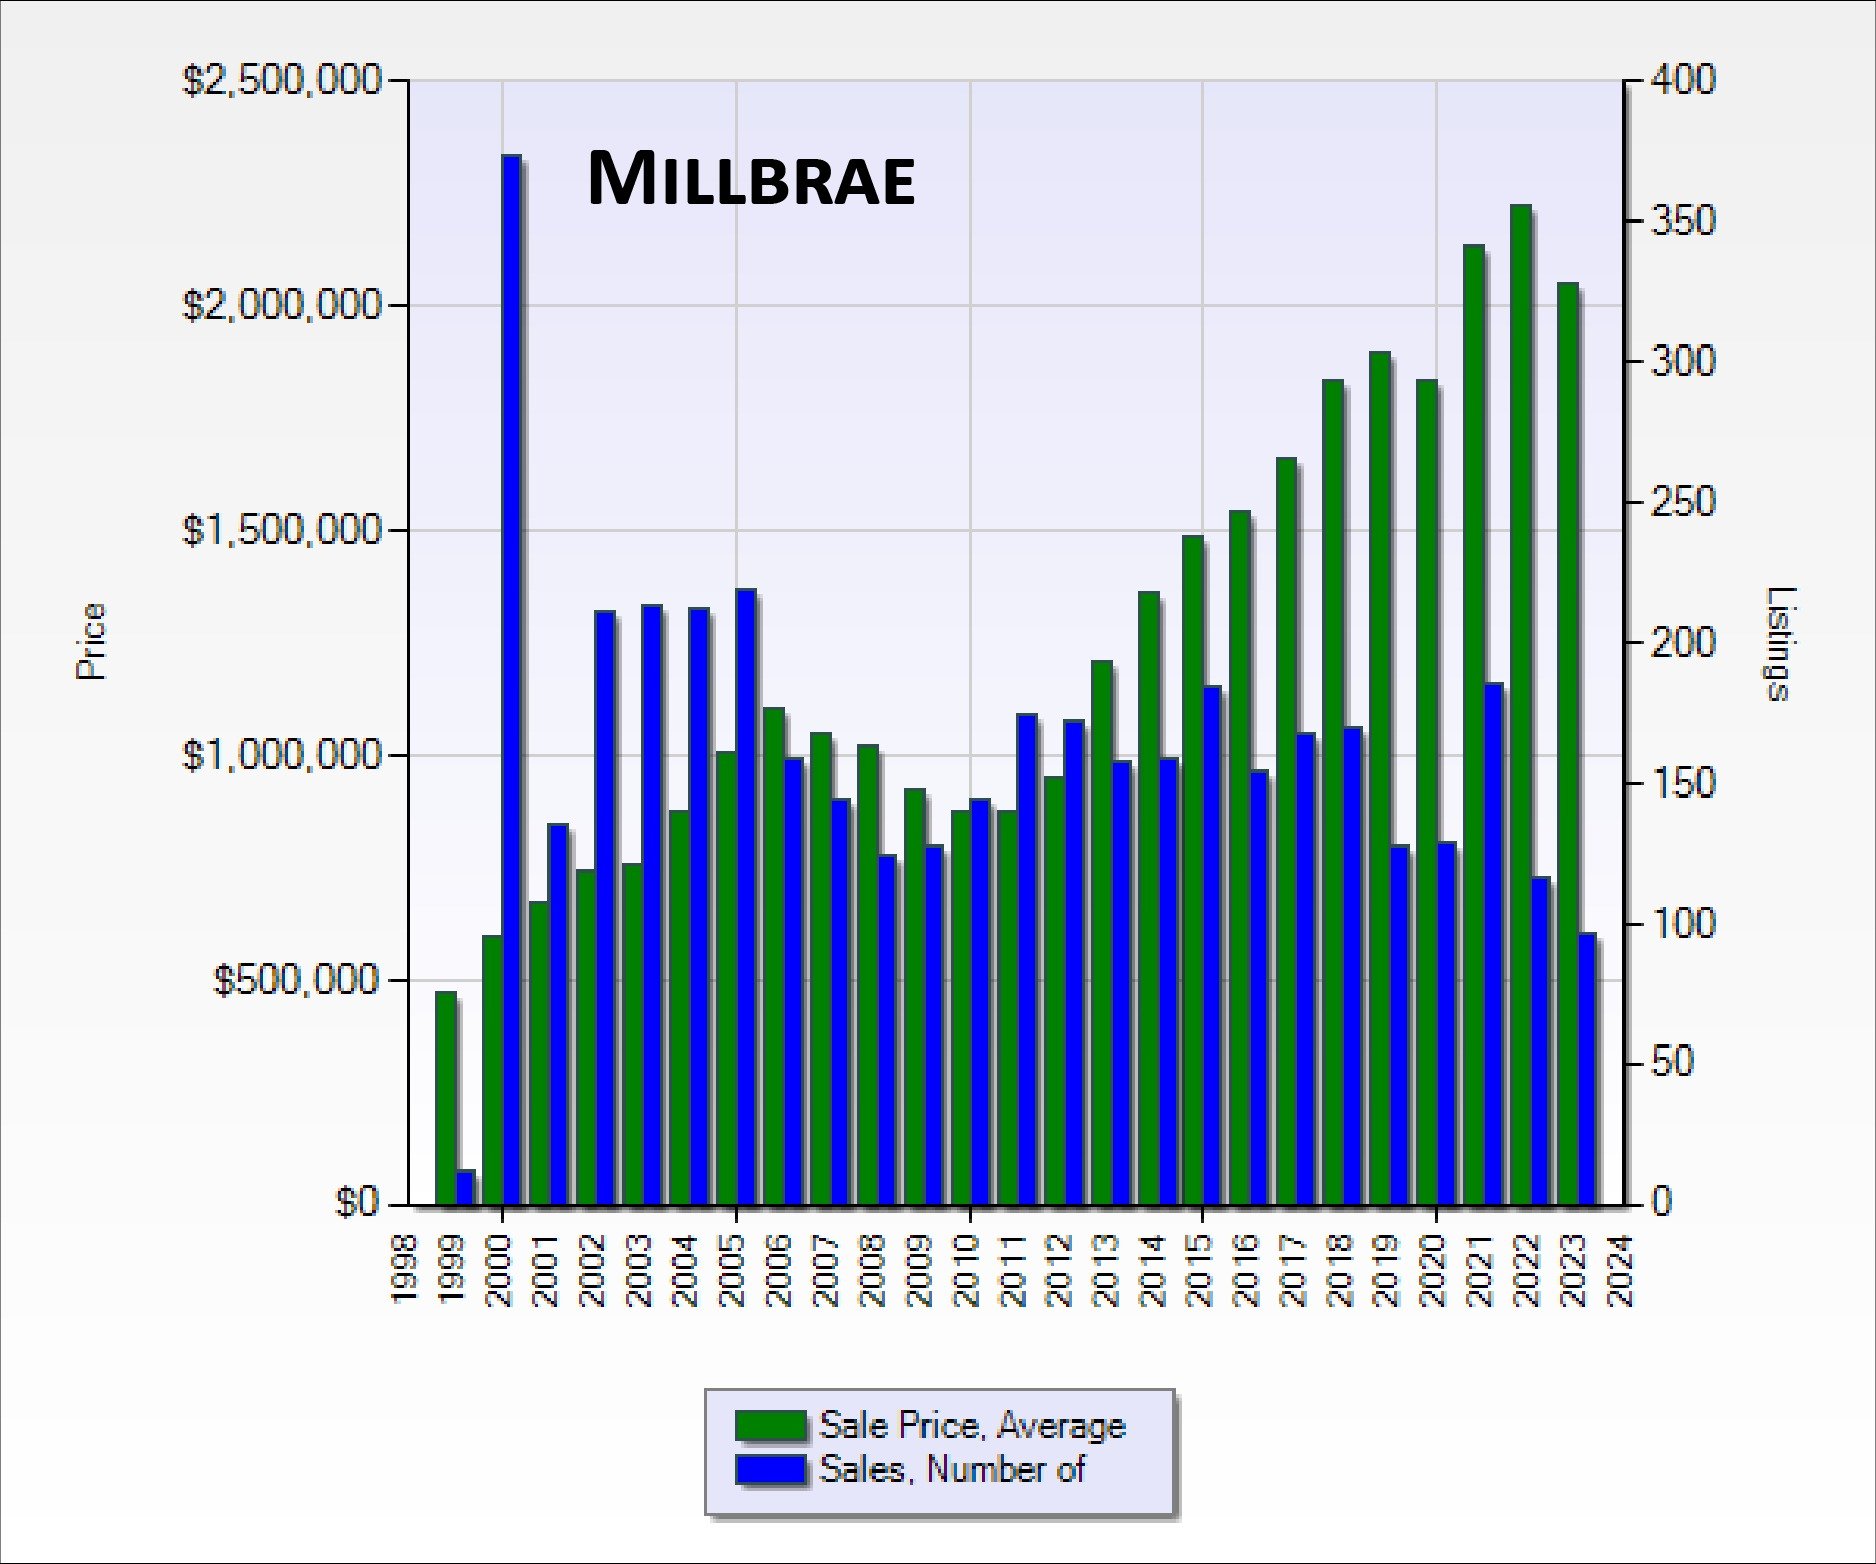
Millbrae chart of annual average sale prices and number of sales from 1998 to 2024.
 
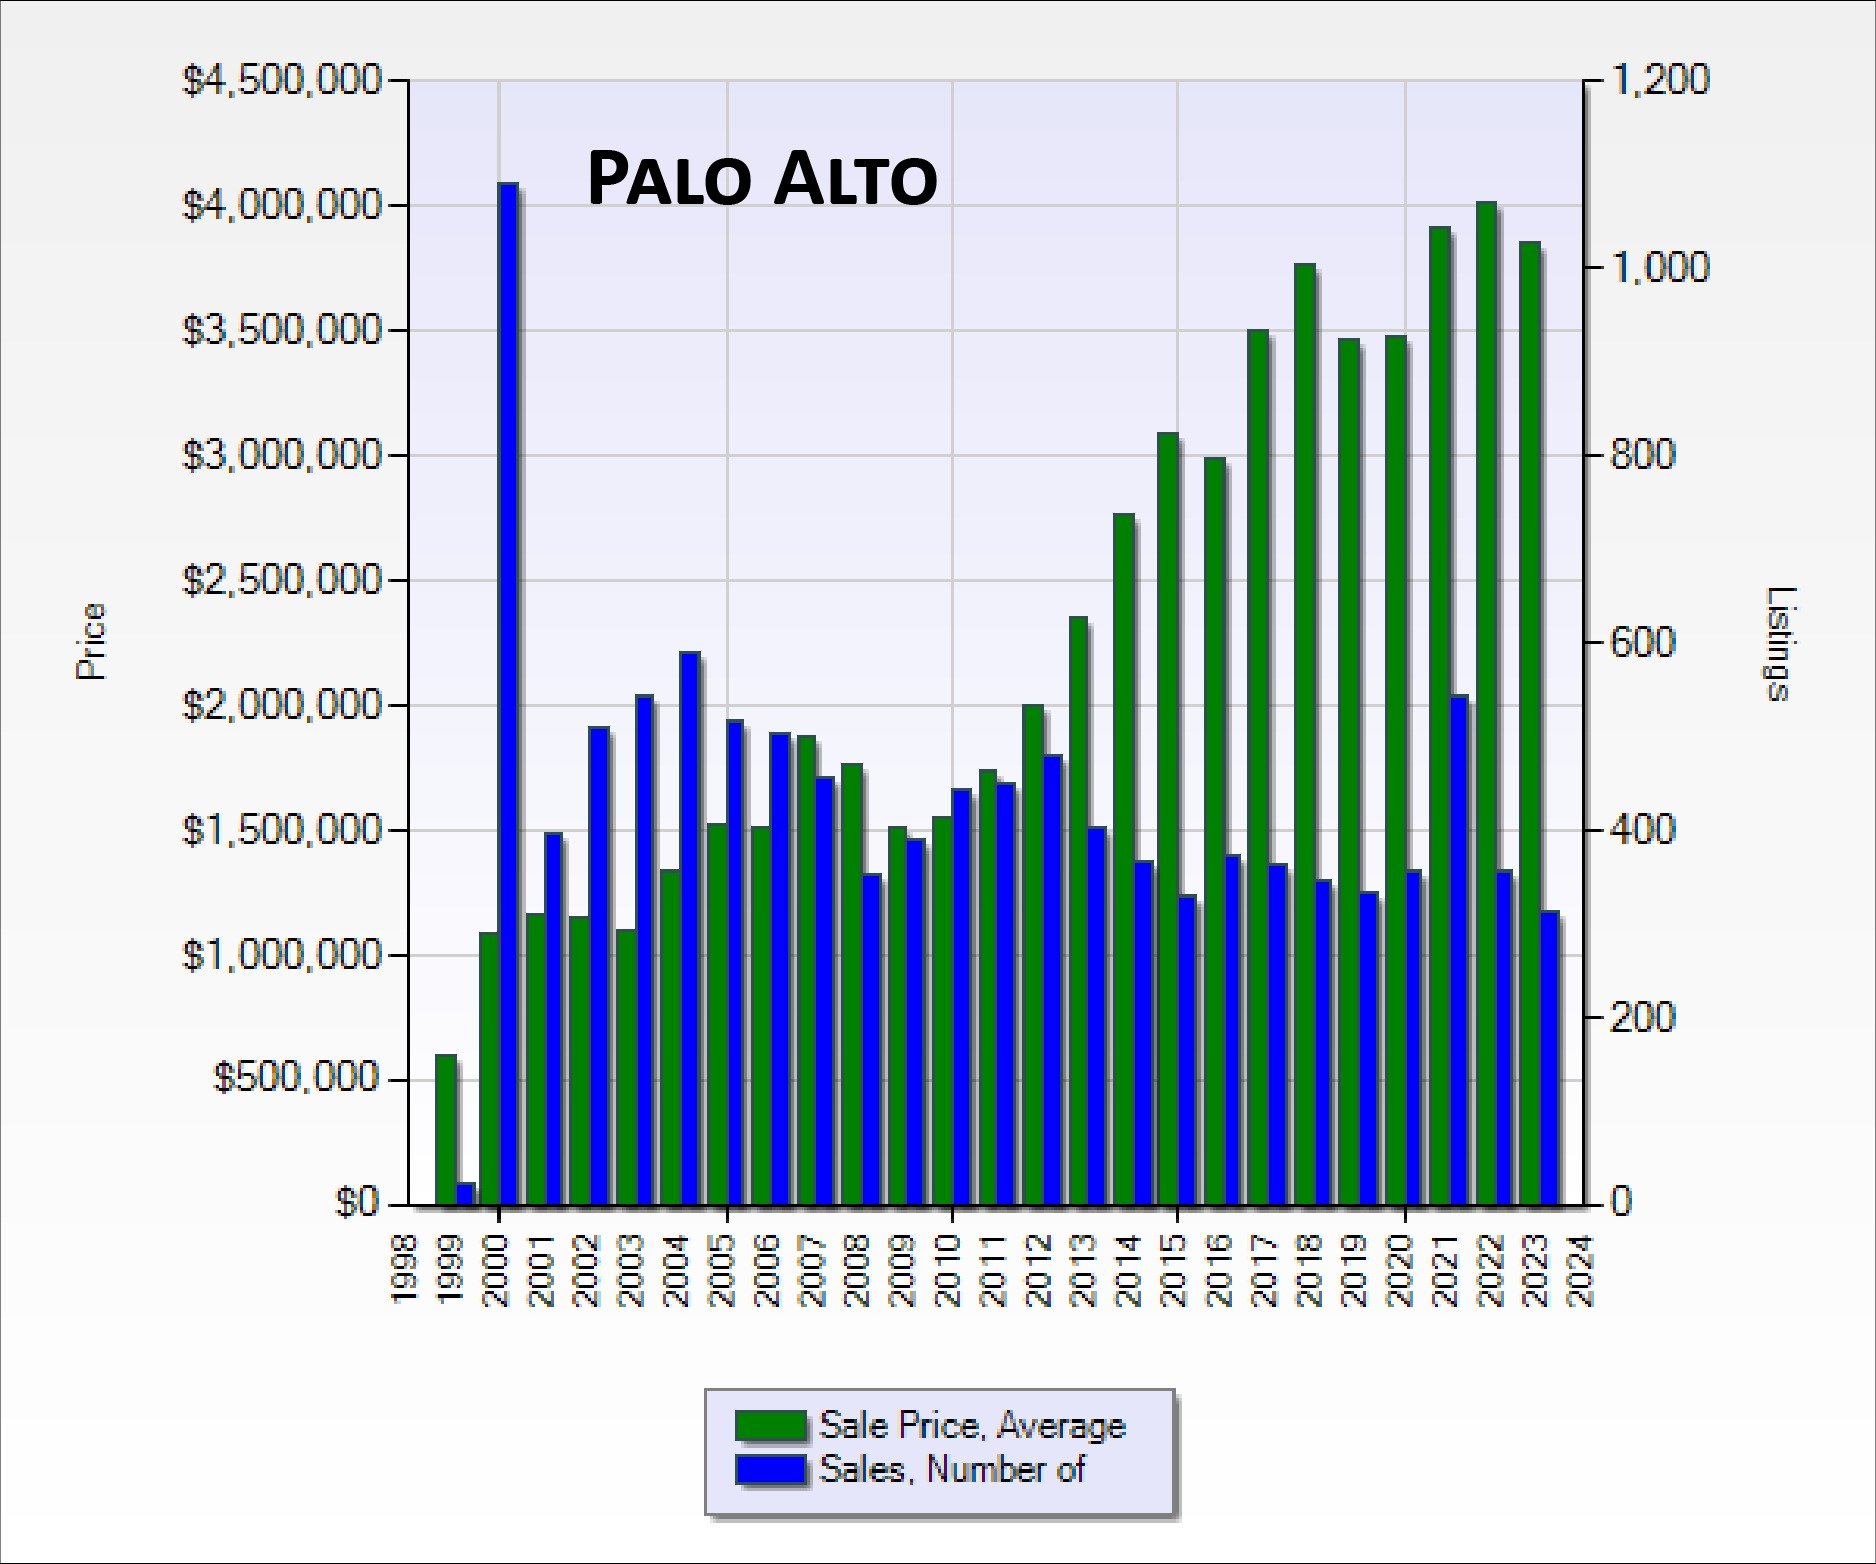
Palo Alto chart comparing average sale prices and number of sales from 1998 to 2024.
 
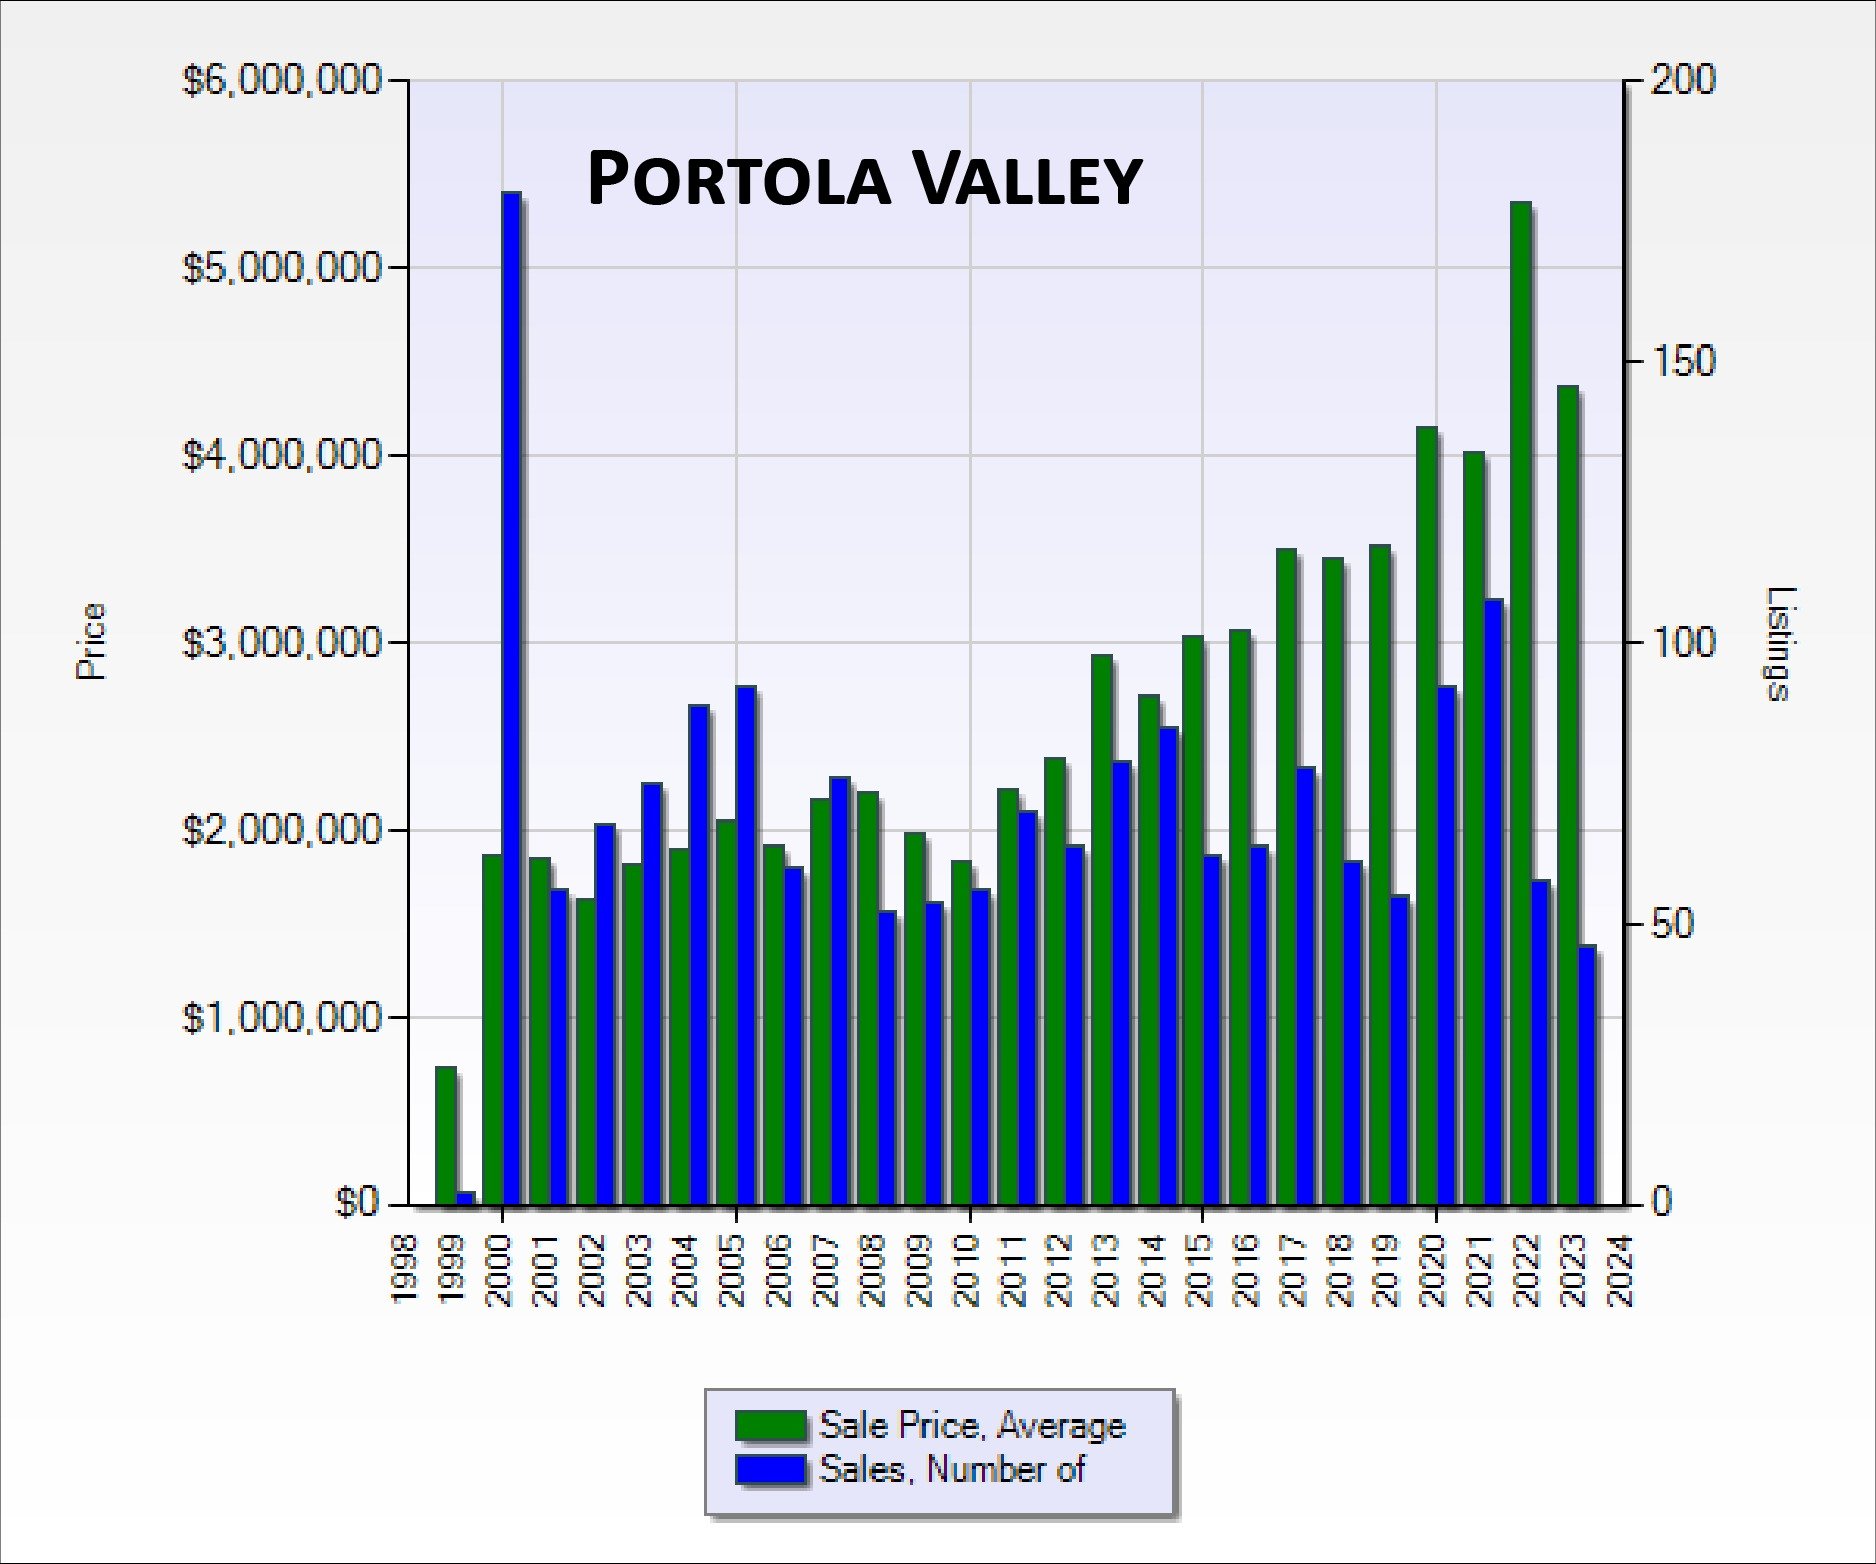
Portola Valley chart comparing average sale prices and sales counts from 1998 to 2024.
 
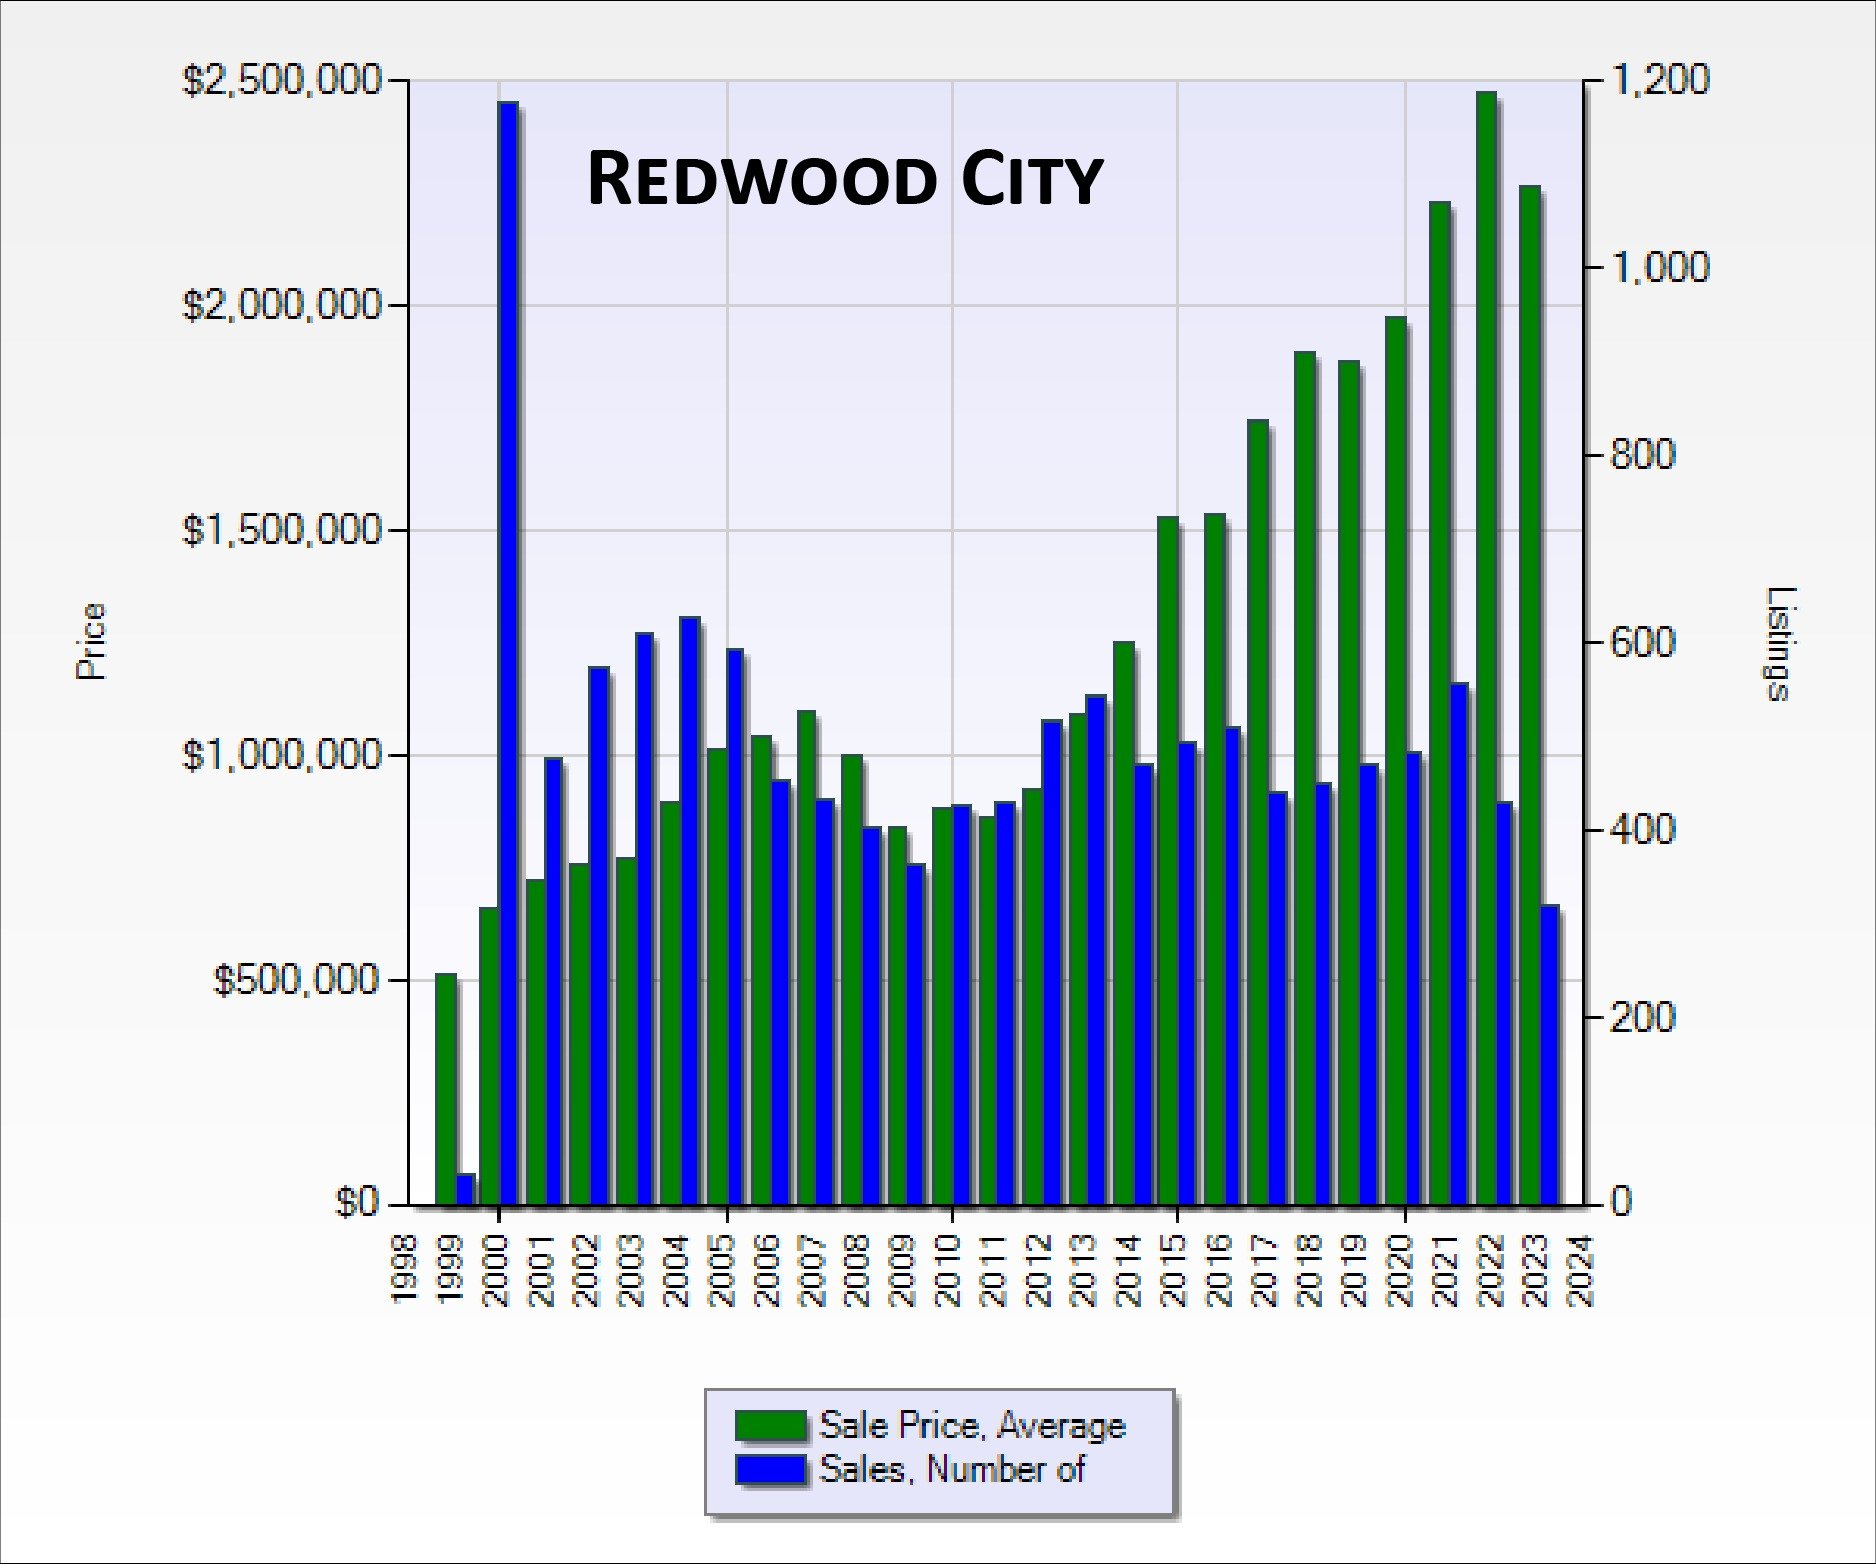
Redwood City chart comparing average sale prices and number of sales from 1998 to 2024.
 
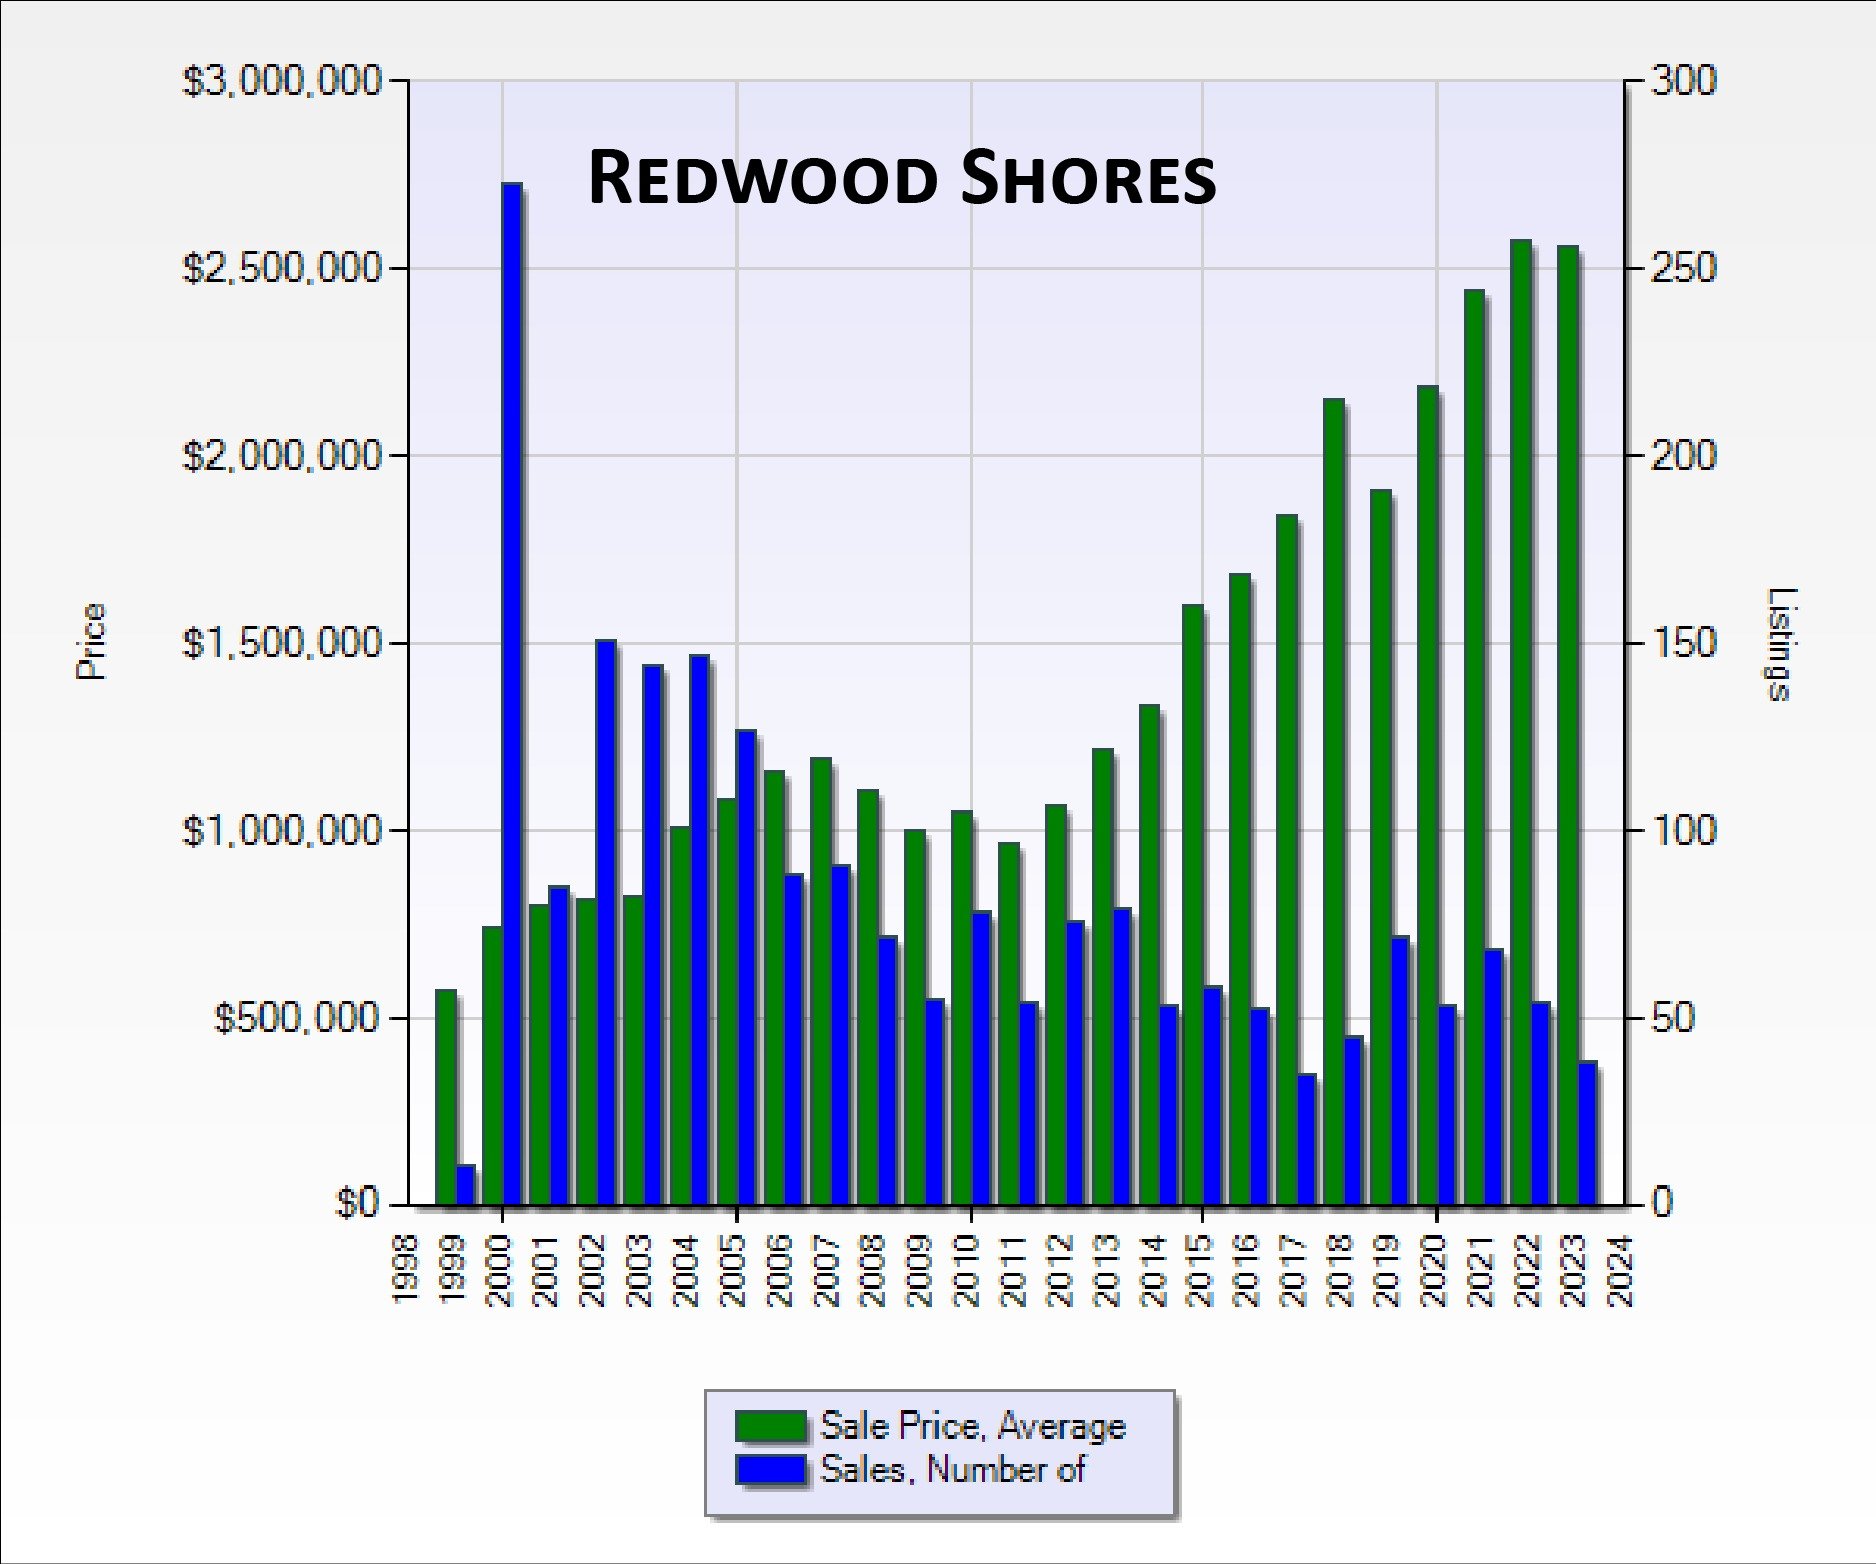
Redwood Shores chart comparing average sale prices and number of sales from 1998 to 2023.
 
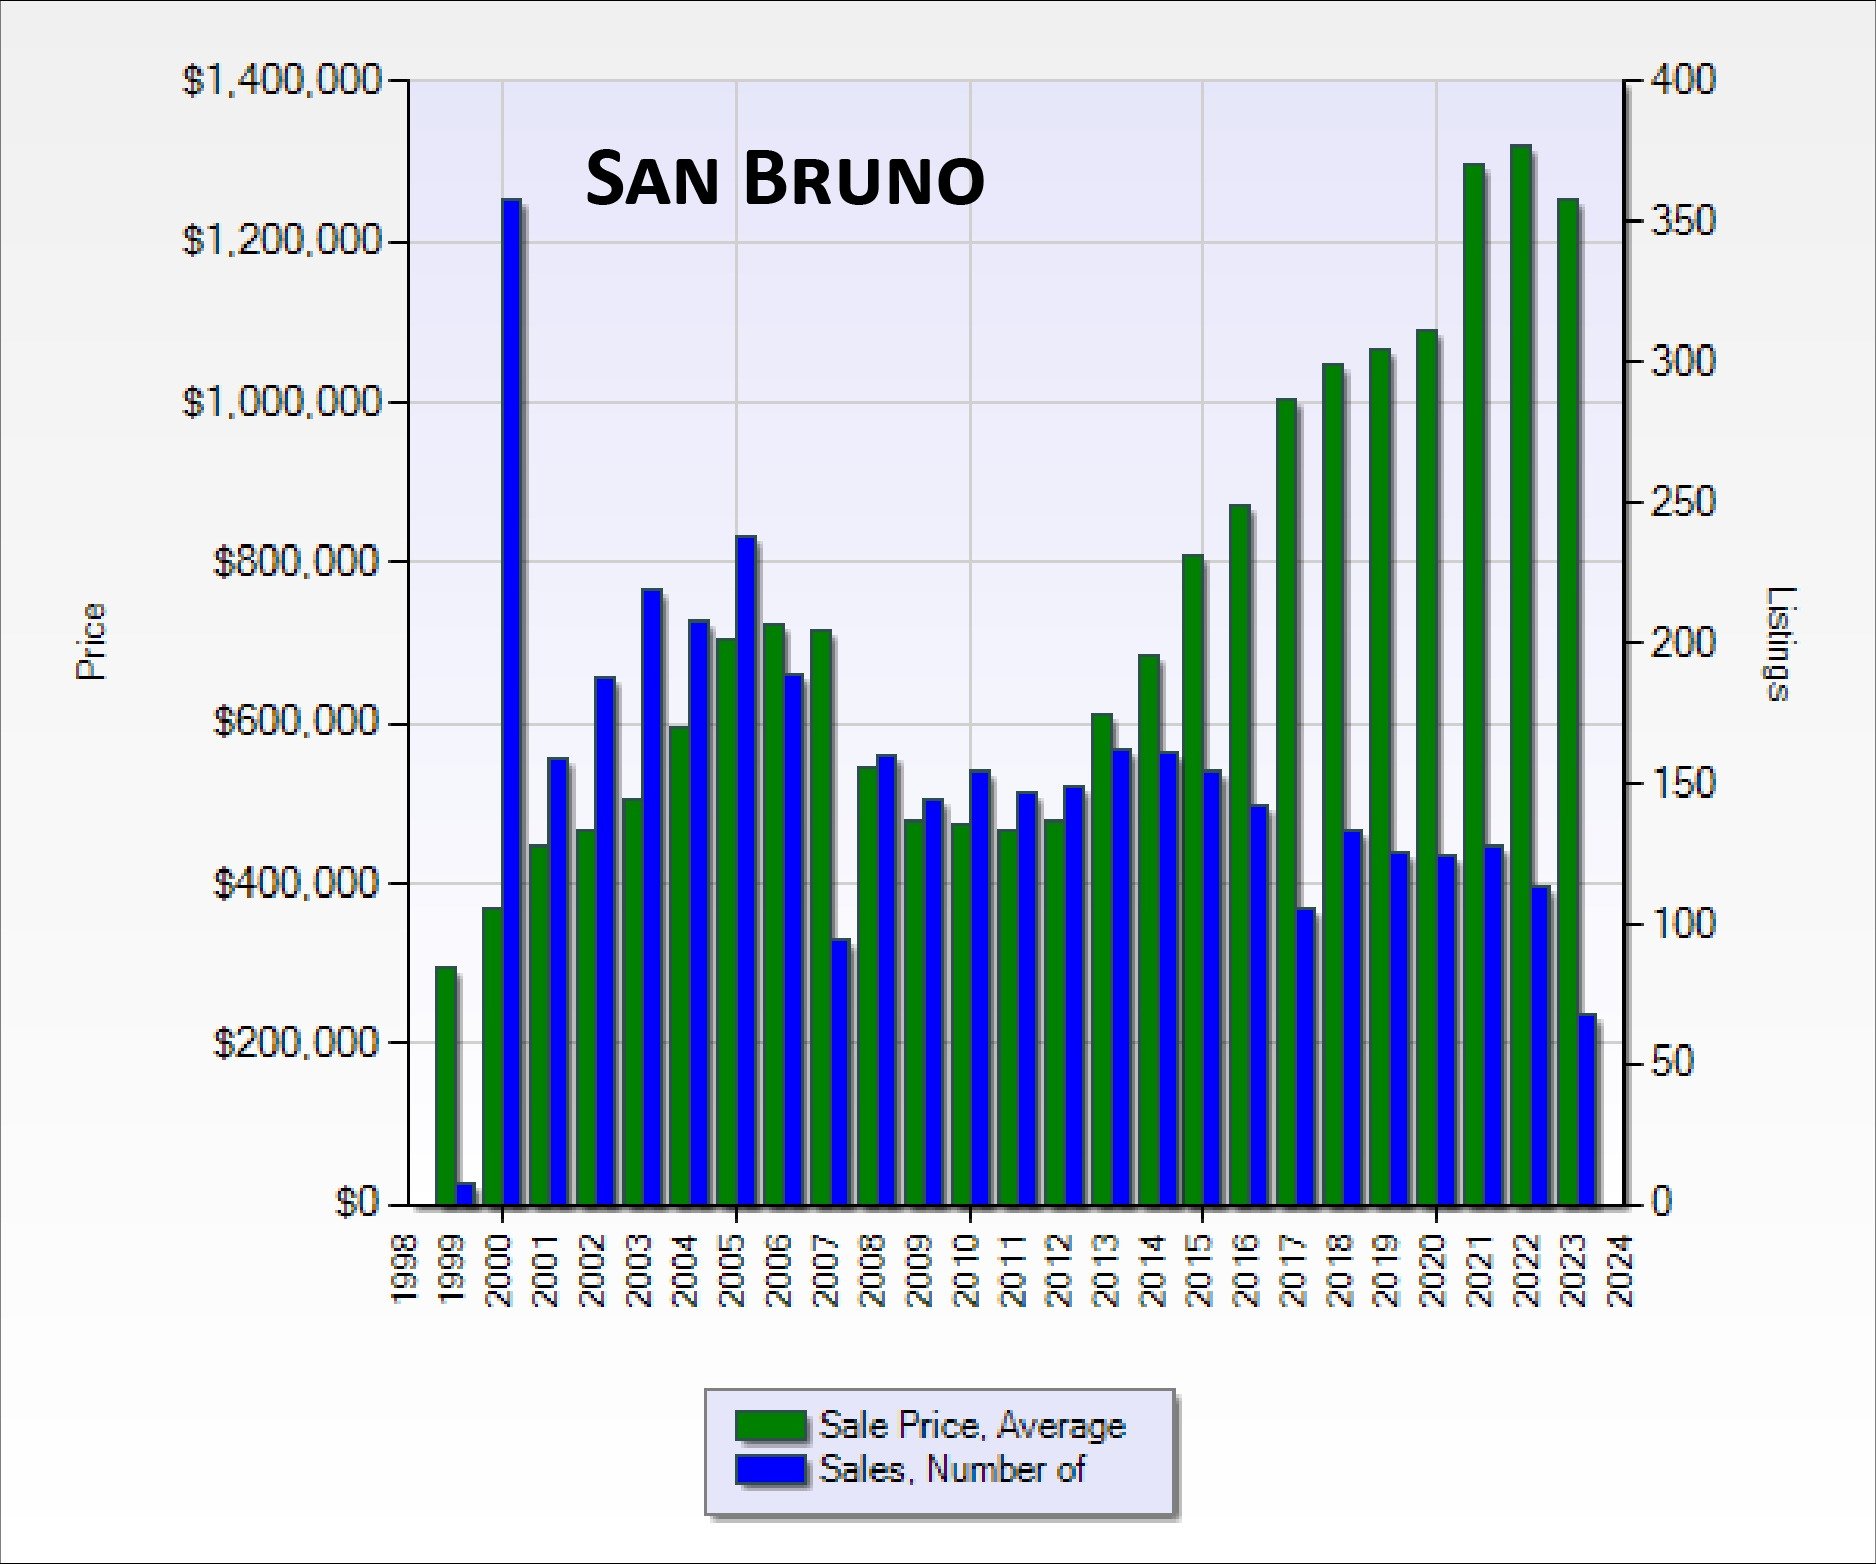
San Bruno chart comparing average sale price and number of sales from 1998 to 2024.
 
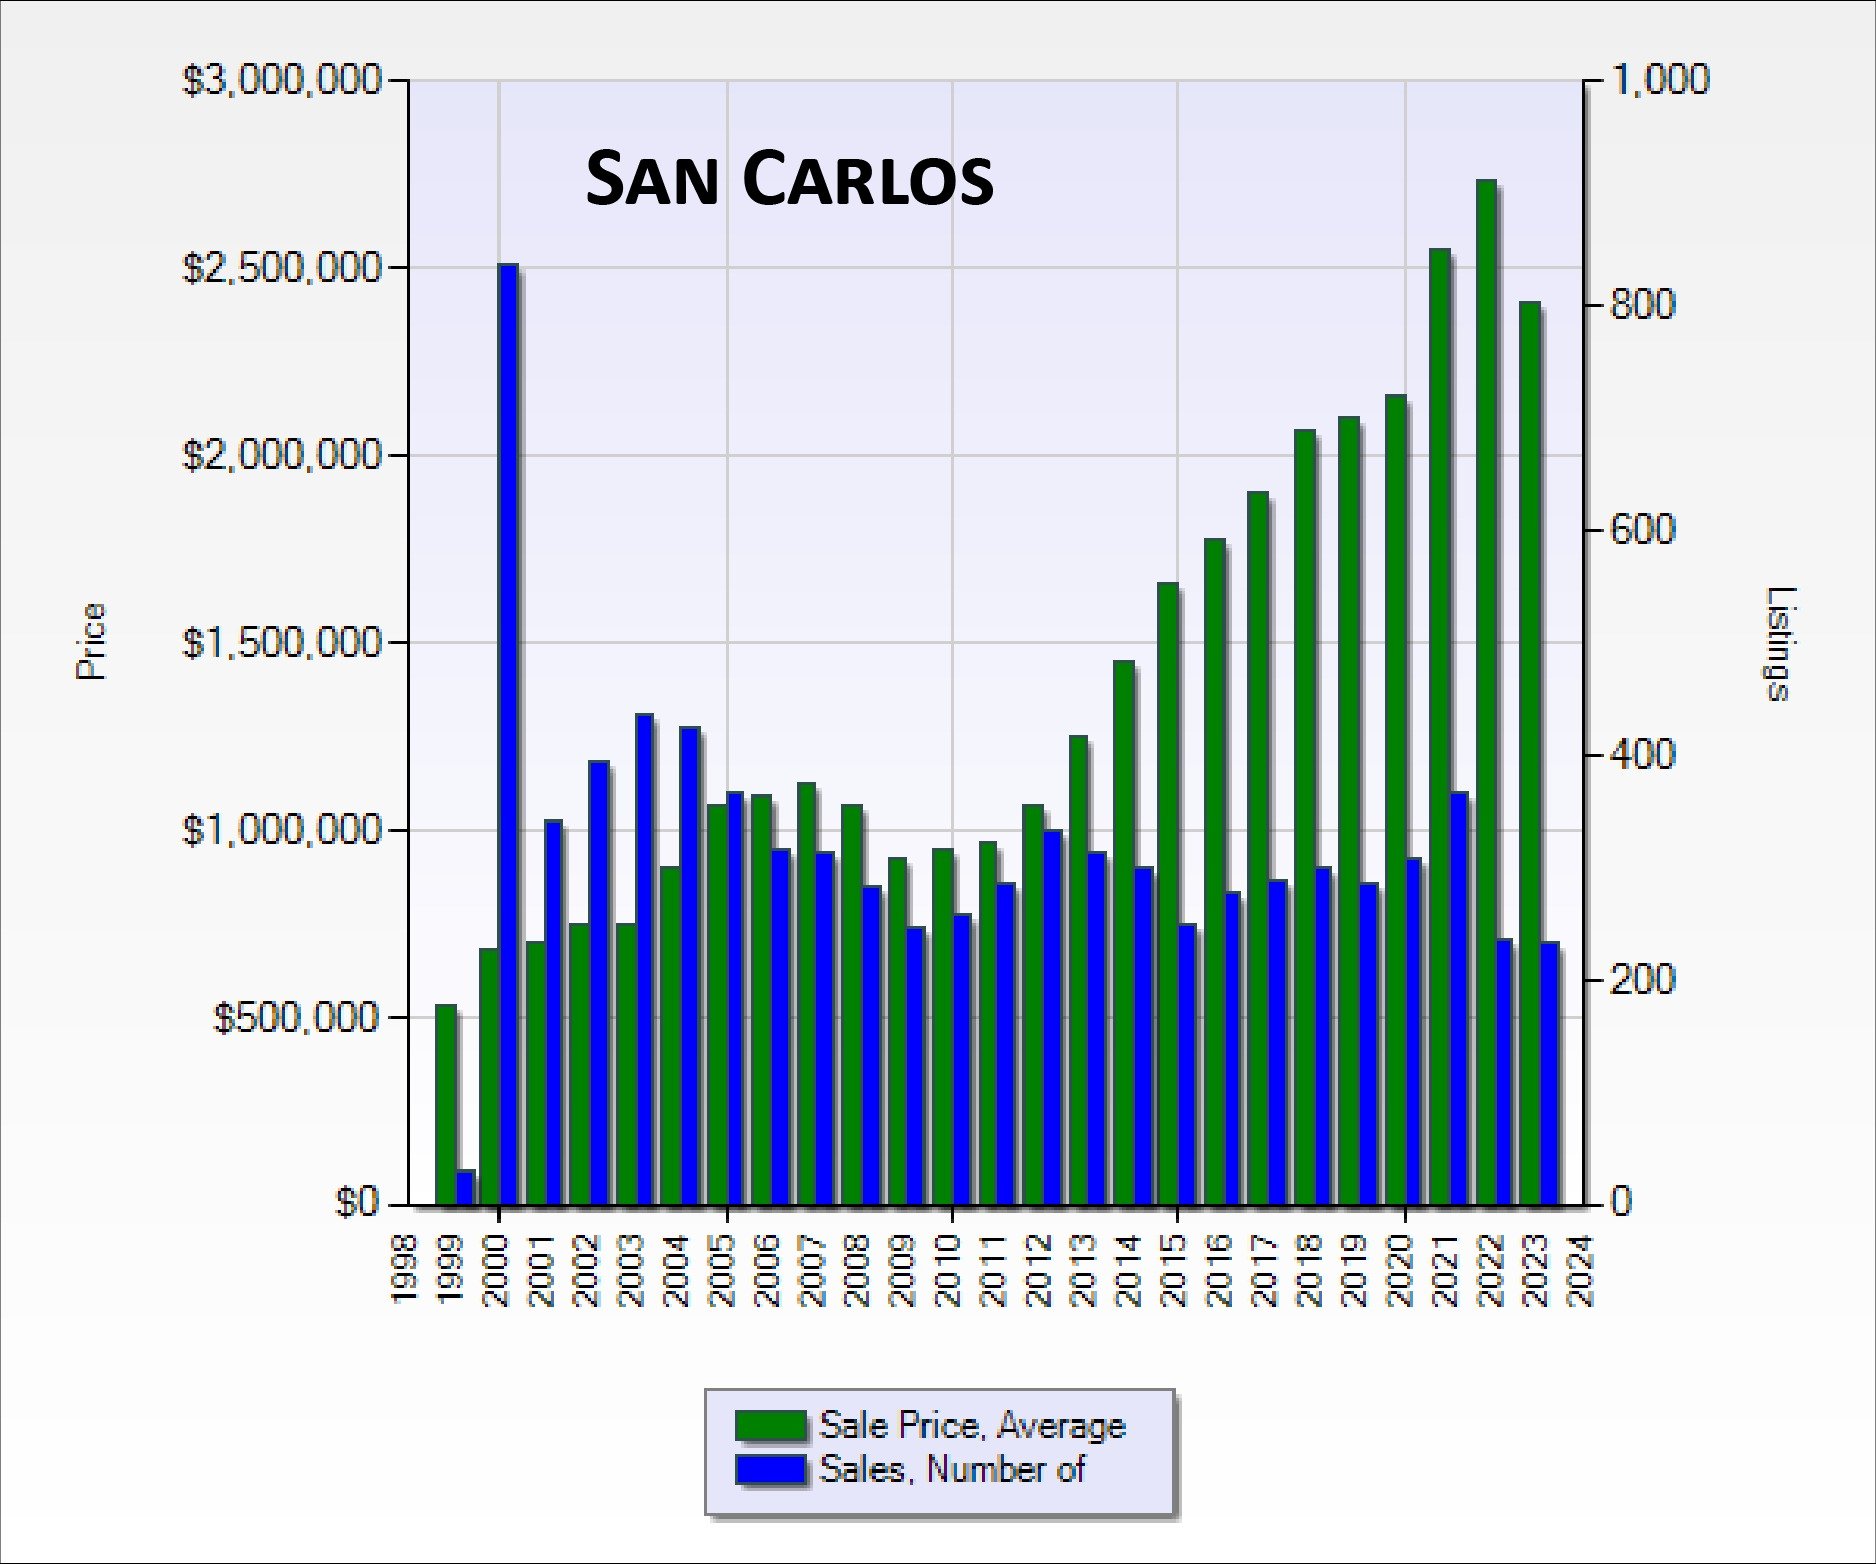
San Carlos chart comparing average sale prices and number of sales by year, 1998–2024.
 
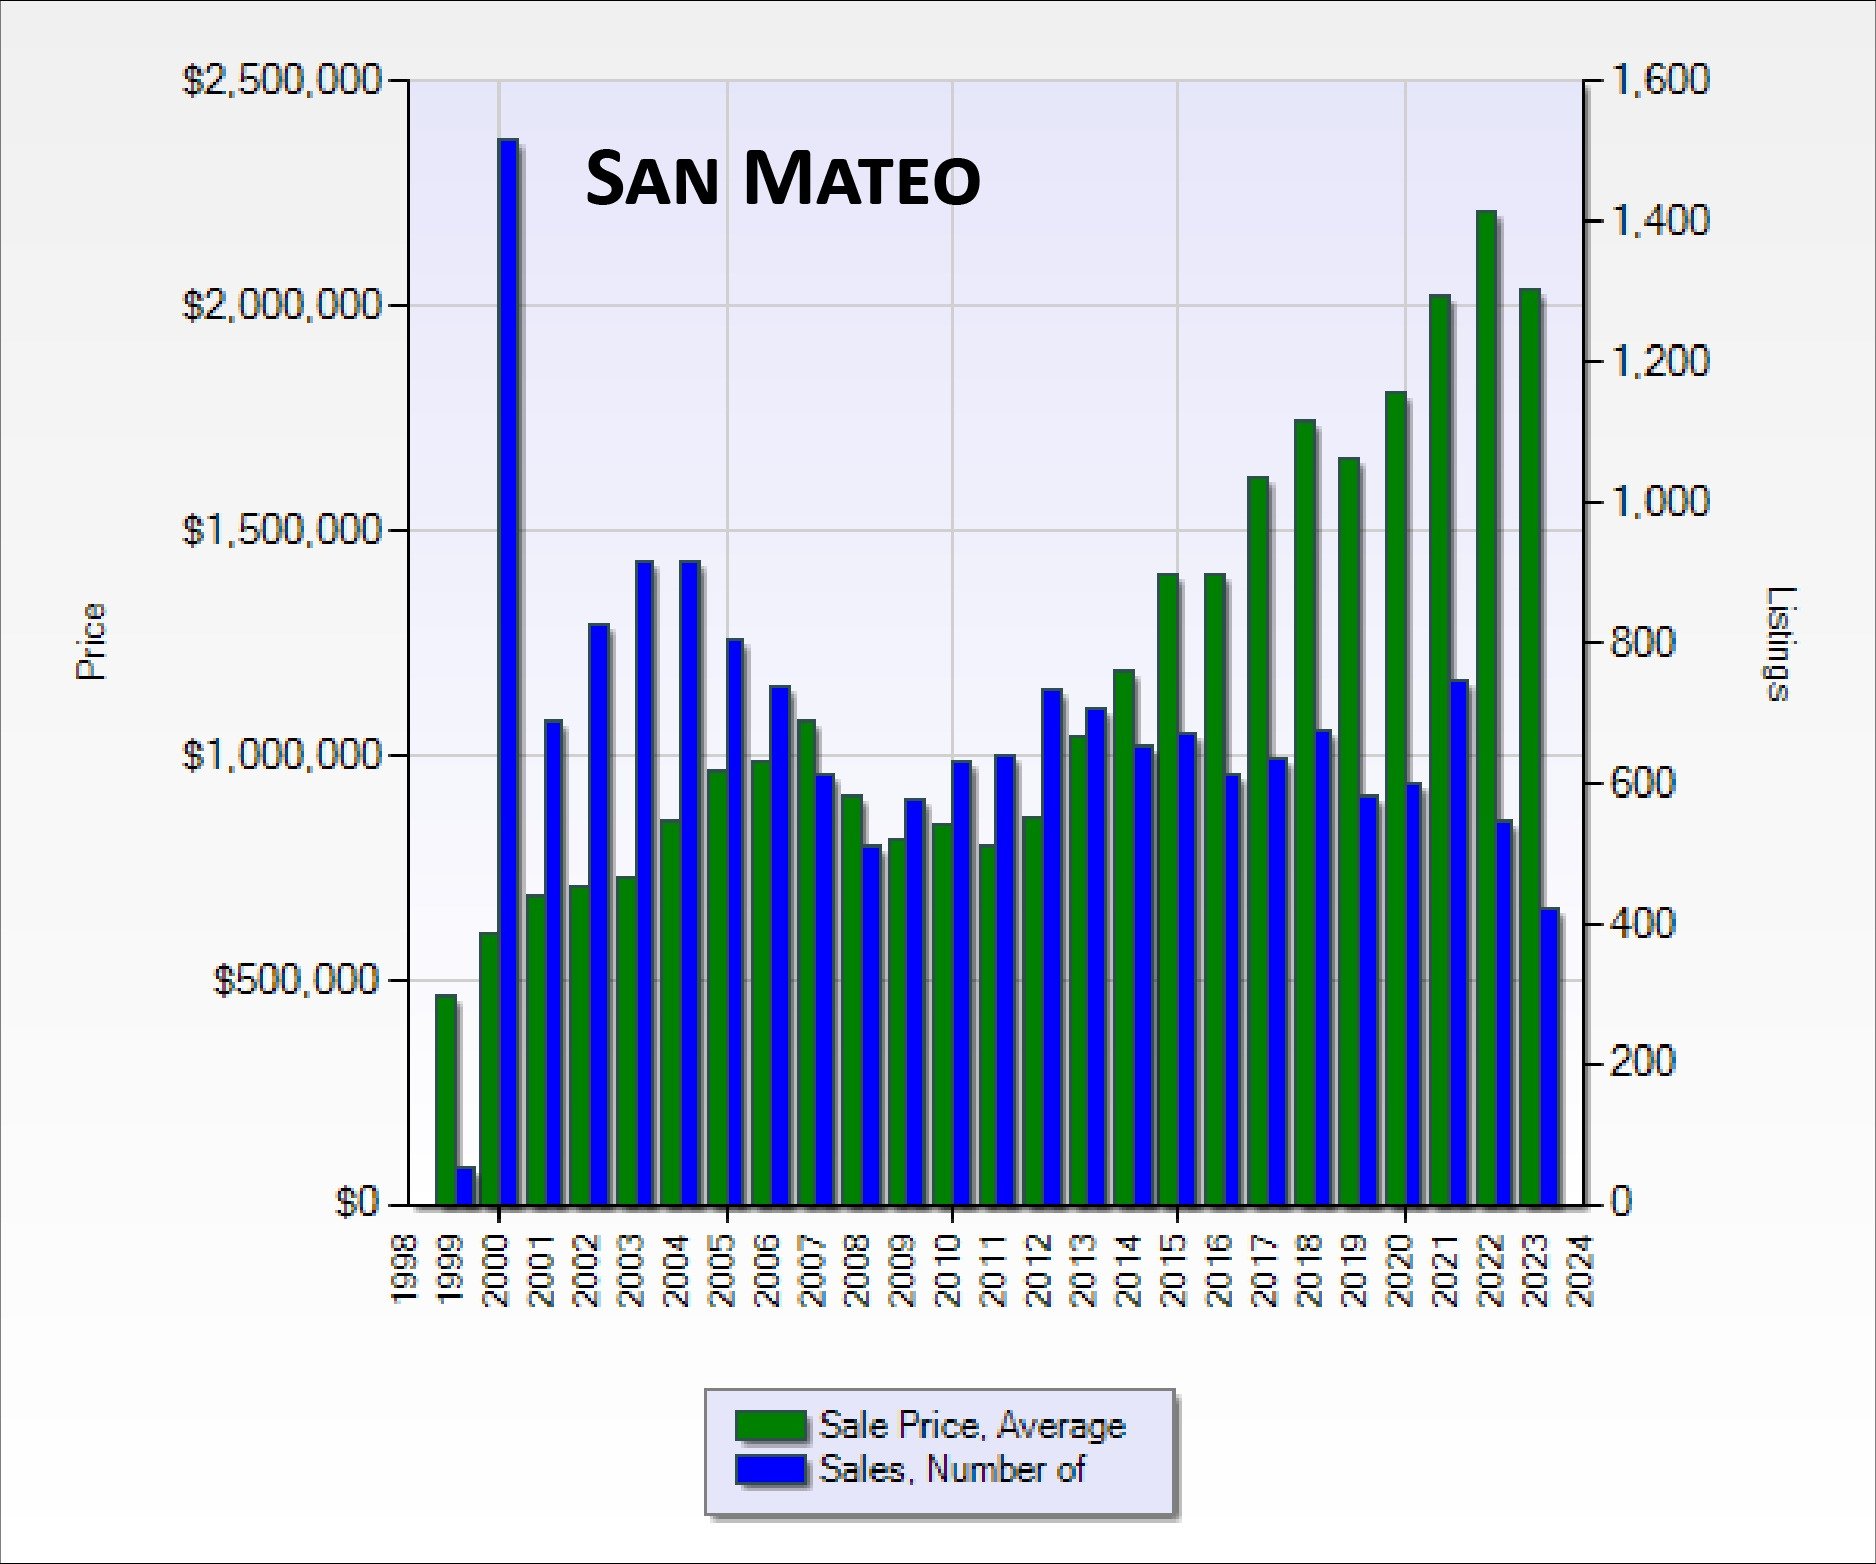
San Mateo chart of average sale prices and sales counts from 1998 to 2024.
 
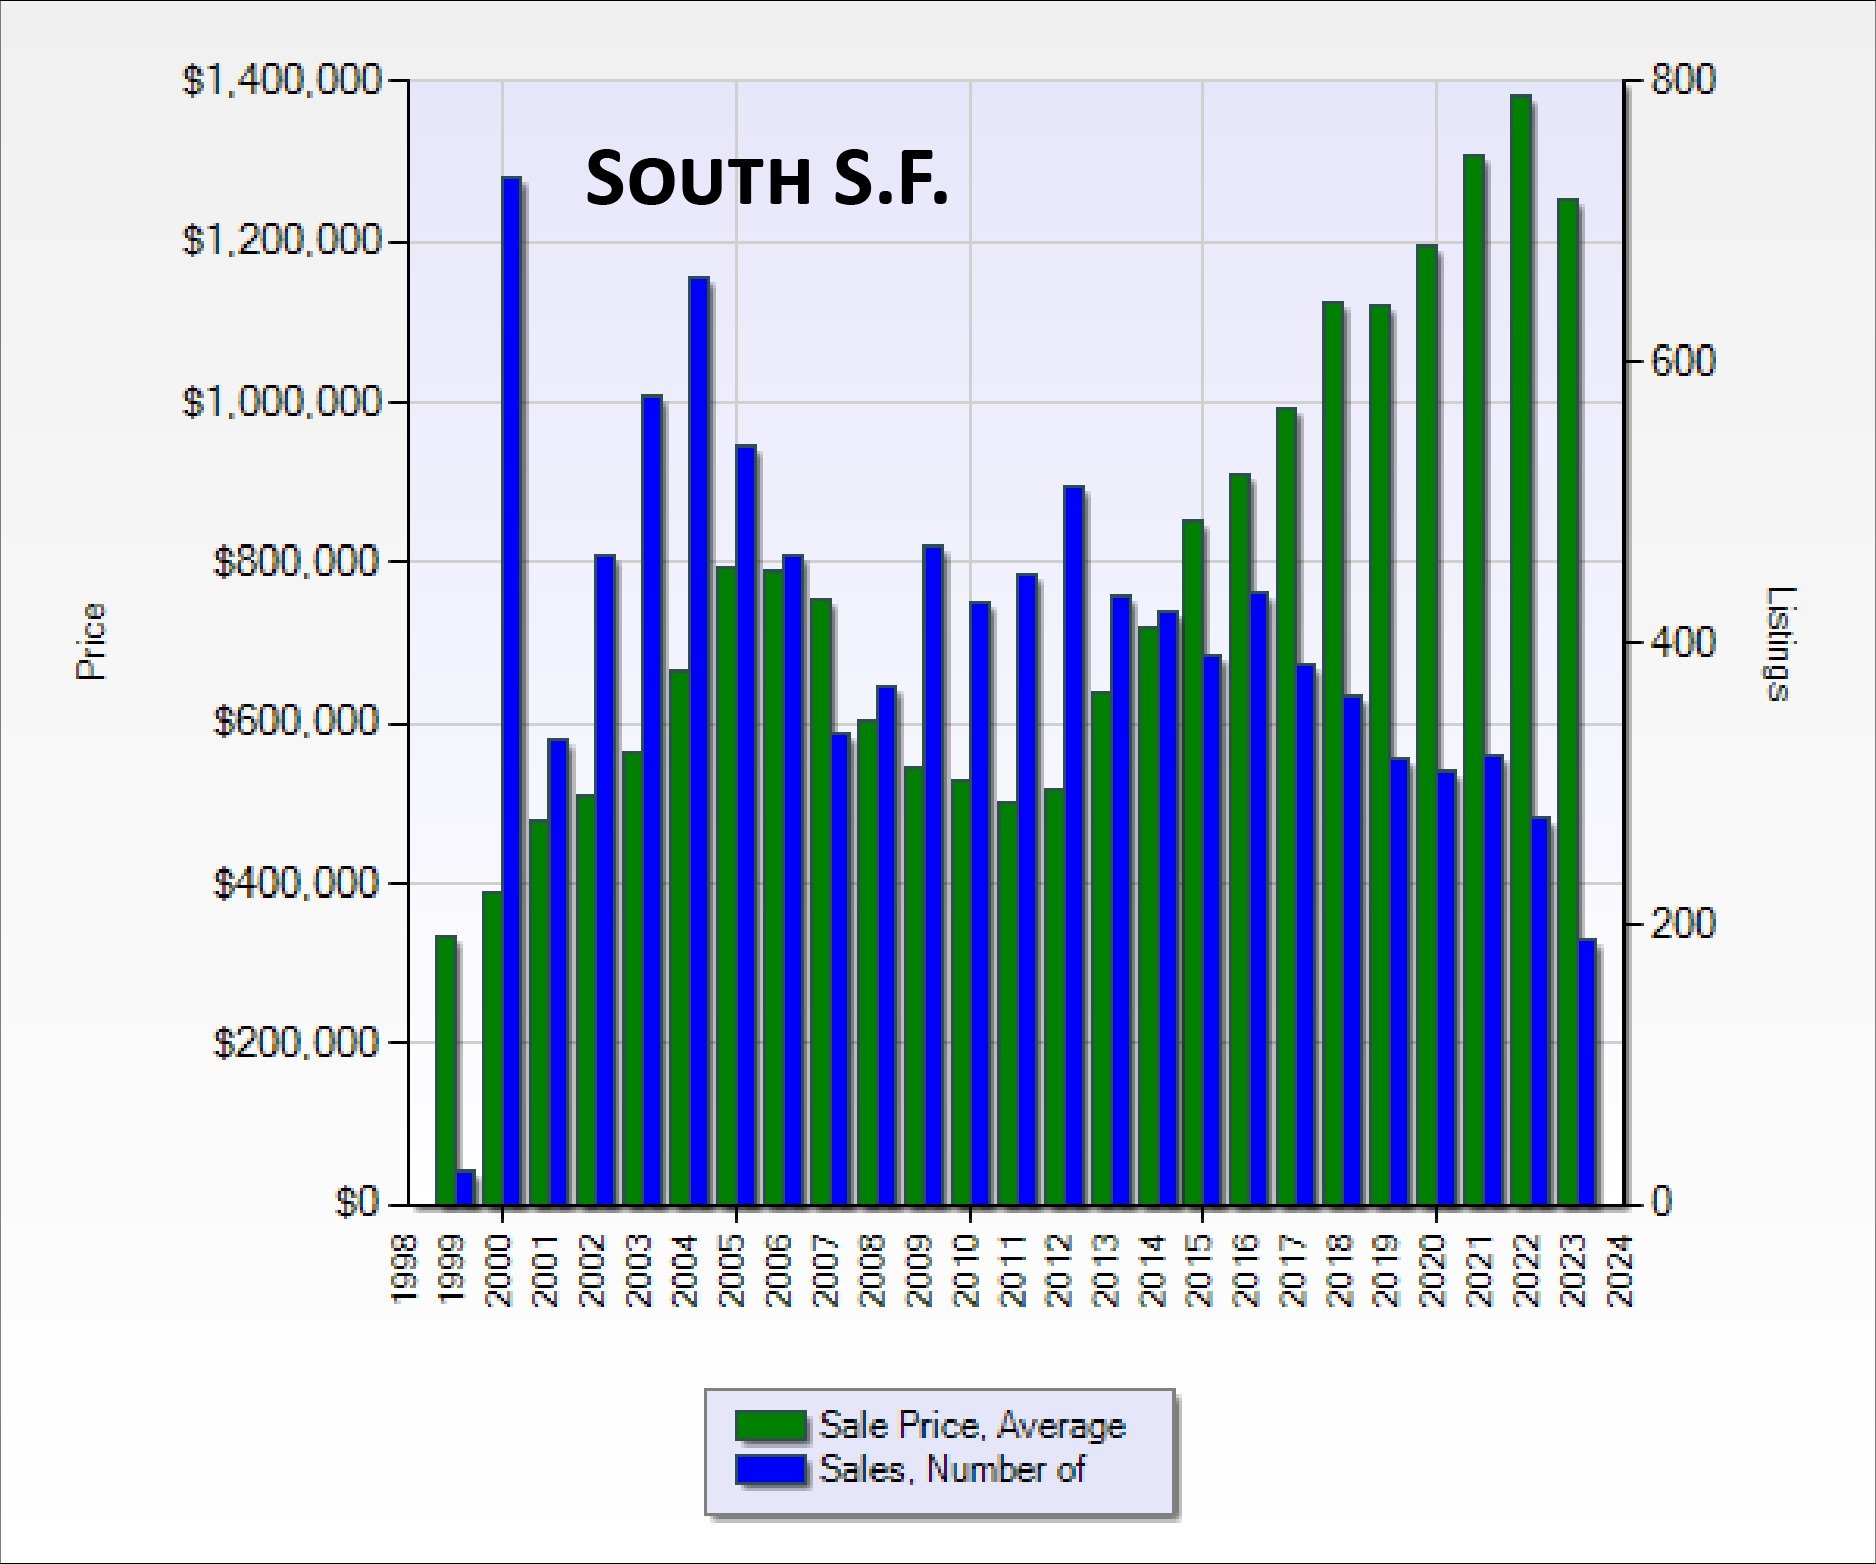
South San Francisco chart comparing average sale prices and sales counts from 1998 to 2024.
 
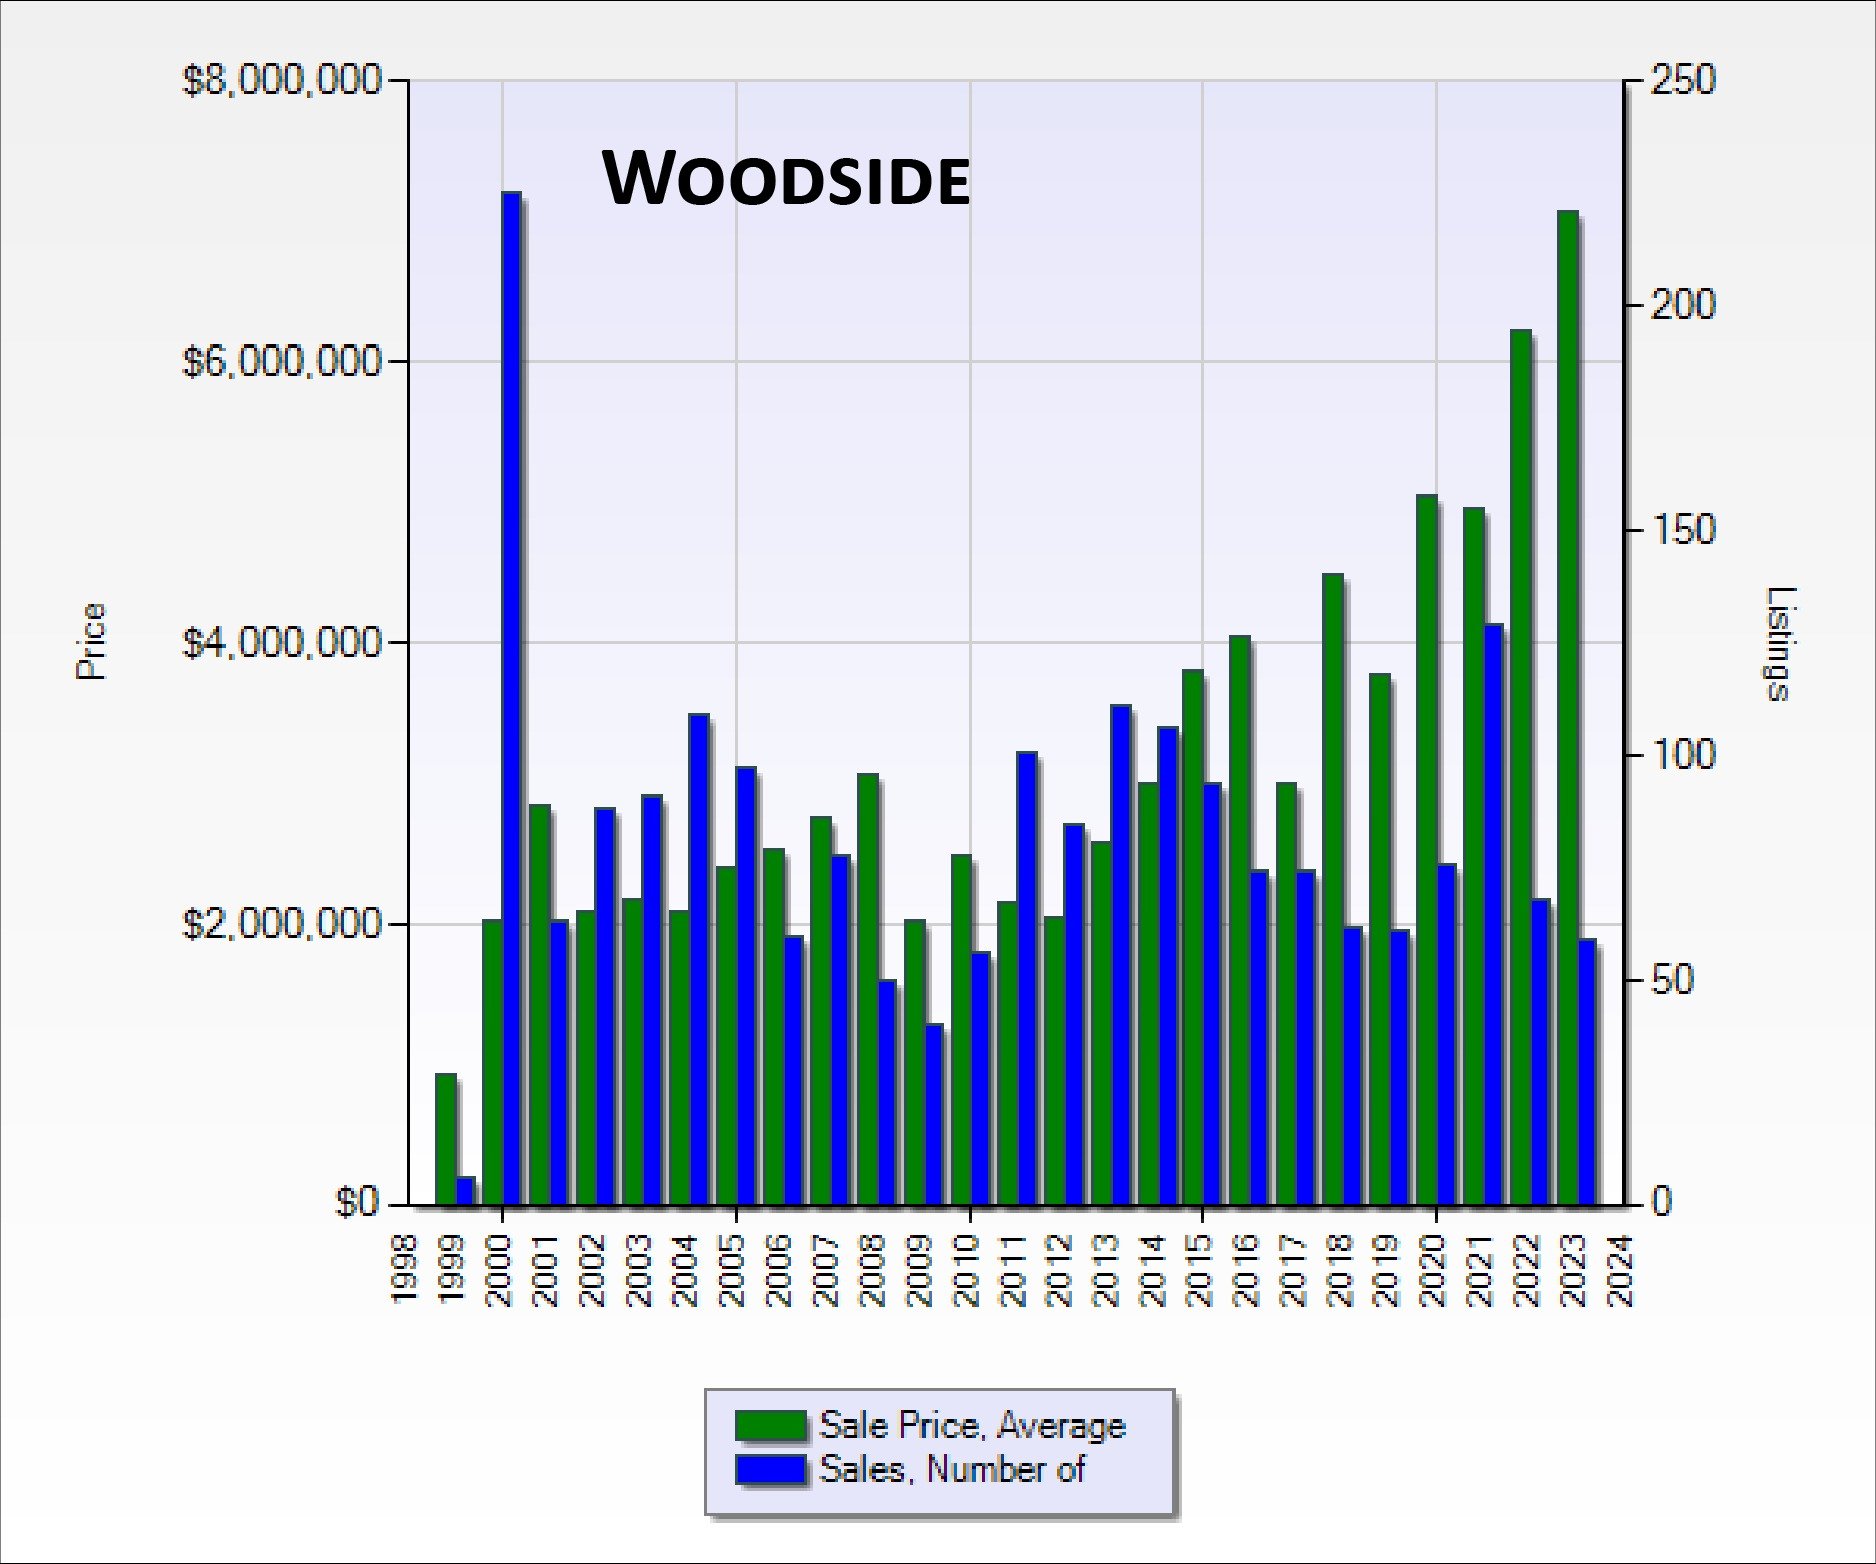
Woodside chart comparing average sale prices and number of sales from 1998 to 2023.

Follow Us On Instagram